
Click to View PDF
With respect to financial markets, March has certainly come in like a lion and while no one definitively knows whether it goes out like a lamb, history is on our side in thinking most of the worst is behind us. We’ve just gone through a 20-day period in the stock market that has represented the 5th fastest 10% decline since 1950. The good news, according to Fundstrat, is that in each of the other 6 occurrences (there are 2 others that took 20 days), the S&P 500 was higher 3 months, 6 months, and 12 months later each time. The average return in those time periods was 8.2%, 15%, and 19.9%, respectively.1
The reign of policy uncertainty has been weighing heavily on the psyche of stock market investors. In fact, the University of Michigan survey showed consumer sentiment fell to 57.9 this month, a 29-month low2. Consumers are starting to show concern over their own employment situation, have a deteriorated outlook in their future finances and have a fearful outlook on inflation, given concerns over implications of potential tariff and trade wars. On the contrary, looking at recent CPI data – which expanded at a .2% monthly rate versus a .3% expectation and down from a .5% monthly increase in January – we are continuing to witness a general softening of inflationary pressures. Further, if we look at Truflation, a measure very highly correlated to CPI, it’s been as low as 1.5% on an annualized basis in recent days. The Truflation Index is a modern inflation measurement tool designed to provide real-time insights into inflation trends. While CPI is calculated monthly by the government, Truflation offers a more dynamic and frequent assessment of inflation, updating daily utilizing more than 13 million census-level data points. However, for the Federal Reserve to cut interest rates further, it will likely have to involve a decline in the PCE (Personal Consumption Expenditures) Index, its preferred inflation measure. Bottomline, while there is uncertainty over policy and impacts related to it, recent inflationary measures suggest the Fed may have some flexibility with easing policy in the months to come — especially if they recognize weakening in economic data and a softer jobs outlook amidst further evidence of cooling inflation.
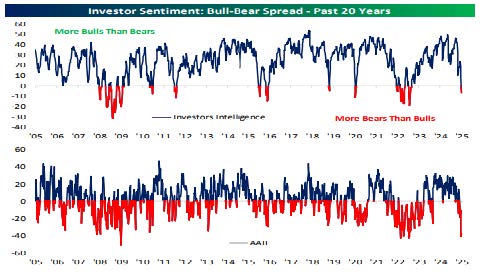
In shifting attention back to sentiment, it’s worth noting just how bad it’s been, as measured by a number of datapoints, but especially in looking at the Investor’s Intelligence Sentiment Index and the AAII (American Association of Investors Intelligence) Survey. As you can see below in the chart from Bespoke, this level of extreme negative sentiment readings has tended to historically coincide with bottoms or a bottoming process in markets.
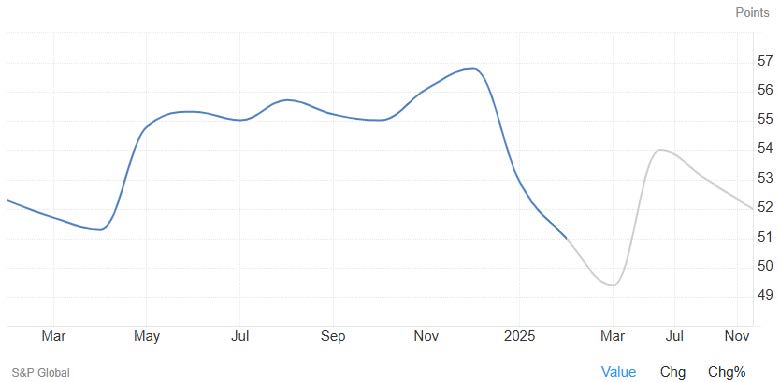
In addressing the recent economic data and increased recessionary concerns being discussed more recently in the financial media, the two following charts measure both services strength and manufacturing strength in the US economy. The services portion of the economy as shown here with the US Services PMI (Purchasing Managers Index), makes up over three-fourths of the US Economy, and while having been quite strong throughout 20243, it has shown some evidence of softening. Despite showing some signs of weakness, a measure above 50 is generally still characterized as being expansionary. While the trend change may be an influence igniting some fear in investors, it’s too early to suggest it’s more than some normal cooling before another re-acceleration.
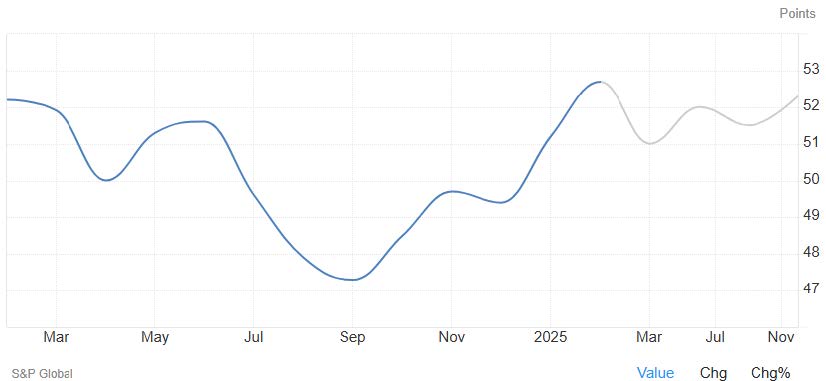
Additionally, the manufacturing sector, as measured here by the US Manufacturing PMI, is waking up from a 26-month contractionary period (reading under 50) from December 2022 until January 2025.
The economy has shown some signs of slowing, as we go through a “detox period” transitioning away from the reliance on government spending, as described by Treasury Secretary Scott Bessent, but by no means are we at a point where it’s lost its footing. In 2024, over one-third of GDP came from government spending, which is a record high, excluding periods of crisis or war, as shown by the chart below from BofA Global Research. This spending was financed by 6-7% budget deficits, which is not sustainable. As the Administration seeks to shrink the government’s economic footprint to transition to private sector-led growth, we can expect more volatility.

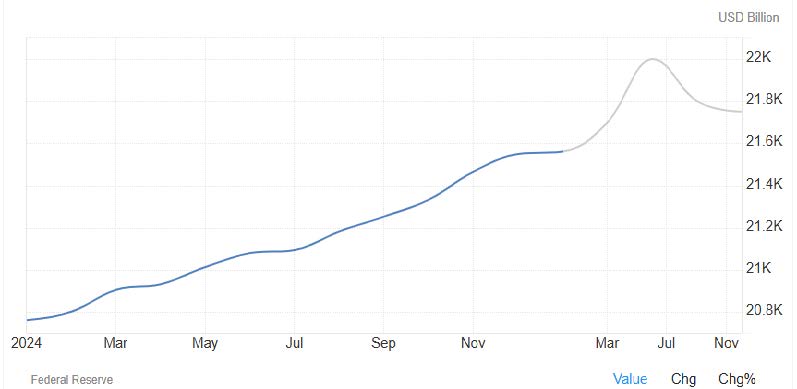
In looking forward to Q2 of 2025, one of the more positive developments for risk assets, such as equities, has been the significant weakening of the US dollar and an overall decline in interest rates. These two factors, along with easing Central Banks, have helped expand global liquidity and M2 Money Supply growth, which is a leading indicator for historically better conditions for risk assets. This was the exact opposite condition from Q4 2024, which has had a lag effect on risk assets, that is arguably showing its effects now. The chart below4 shows the recent stalling out and projected expansion in M2 Money Supply, helped by declining interest rates, a weakening US dollar, and accommodative central bank policy.
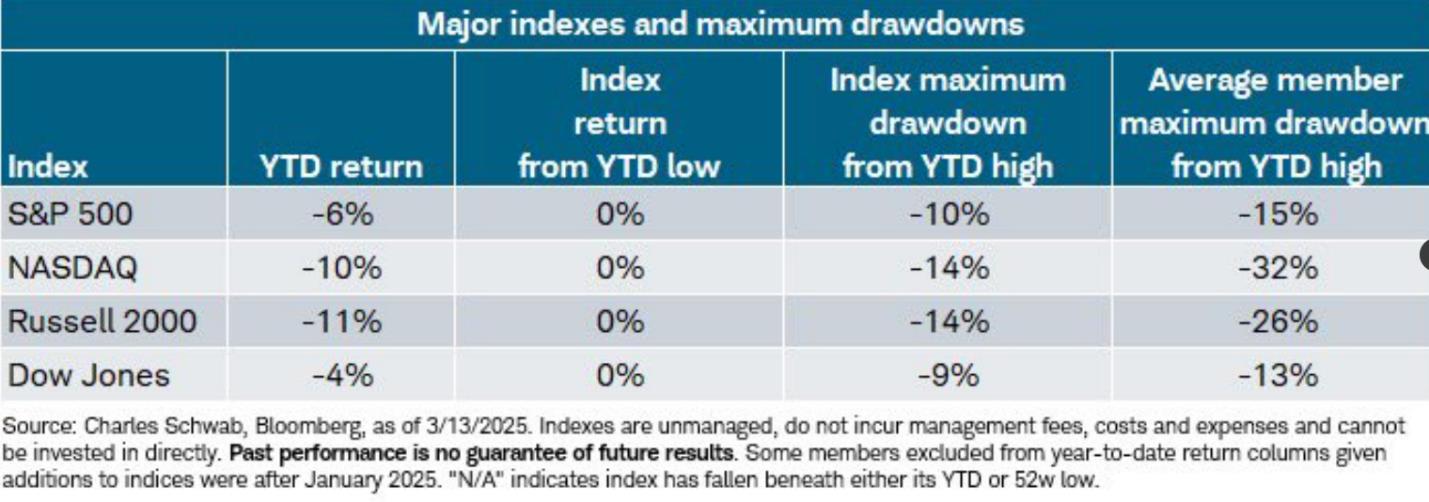
In some final notes about recent market action, as this chart from Liz Ann Sonders of Charles Schwab highlights, the average stock in the main US stock indices have experienced a tremendous amount of downside already, below the surface level of the index. Specifically, the average stock in the NASDAQ Composite is down 32% from peak levels, through the end of trading on March 13, 2025.
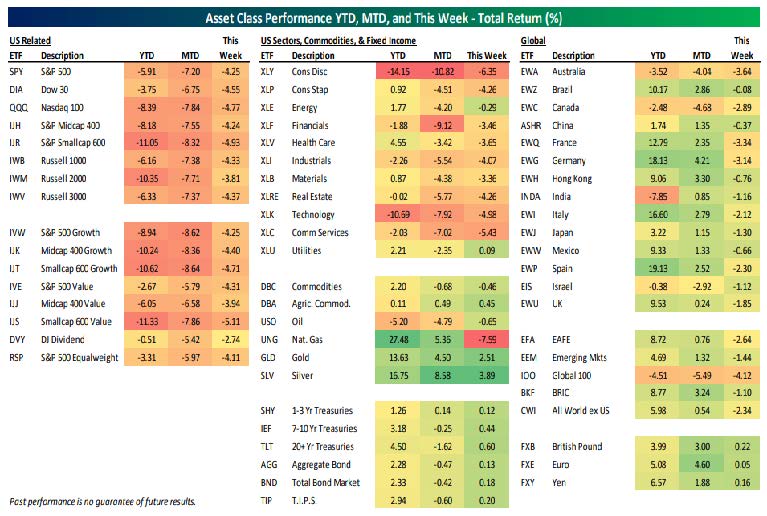
This is a year where proper diversification across assets, globally, can show impactful benefit, recognizing that thus far in 2025, we’ve experienced renewed strength in international markets, along with fixed income, after a more meager 2024 for both of those asset classes, at the index level at least. The March 14, 2025 chart from Bespoke featured below, highlights assets outside of US stocks that have fared much better so far this year.
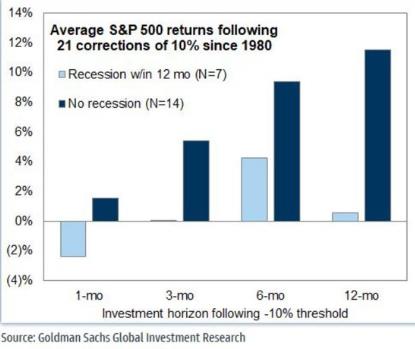
In wrapping up, we realize the recessionary chatter and concerns that have been fueled by the tremendous amount of uncertainty. Sentiment is extremely negative, as concerns mount over a weakening US economy; however, it remains on stable ground, and inflation continues to ease. With easing Central Bank policy, a declining US dollar, and a softening in interest rates, financial conditions should continue to ease and global liquidity should continue to expand, helping shift what has been a recent headwind, into a tailwind for risk assets, i.e. equities. While a near-term recession appears possible, but not probable, market corrections, as we’re currently experiencing, have tended to lead to constructive equity markets going forward, especially in those non-recessionary times. Goldman Sachs Global Investment Research highlights the 21 market corrections of a decline of 10% or more since 1980 and shows the subsequent S&P 500 returns in both recessionary and non-recessionary conditions within 12 months. It’s worth noting that neither has been a terrible outcome in the past 45 years.
As is always the case, proper portfolio diversification and appropriate risk management can help investors weather the volatility storm that we’ve seen and may likely continue to see. Let your financial plan help dictate your portfolio strategy and have proper risk management, portfolio rebalancing, and a diverse mix of assets to help you meet your long-term goals.
Important Disclosures:
Investment Advisory Services offered through Krilogy Financial® (“Krilogy”), an SEC Registered Investment Advisor. Please review Krilogy’s Client Relationship Summary (“CRS”) and Form ADV 2A (“Firm Brochure”) carefully prior to investing.
All expressions of opinion are subject to change. This information is distributed for educational purposes only, and it is not to be construed as an offer, solicitation, recommendation, or endorsement of any particular security, products, or services, nor is it to be construed as individualized advice or recommendations suitable for the reader.
Diversification does not eliminate the risk of market loss. Investments involve risk and unless otherwise stated, are not guaranteed. Investors should understand the risks involved of owning investments, including interest rate risk, credit risk and market risk. Investment risks include loss of principal and fluctuating value. There is no guarantee an investing strategy will be successful. Past performance is not a guarantee of future results.
Sources:
1 Fundstrat Chart of the Day 3-11-25
2 Rachel Barber USA Today 3-14-25
3 S&P Global and Trading Economics global macro models and analyst expectations
4 Federal Reserve and Trading Economics global macro models and analyst expectations