
Click to View PDF
Take a deep breath, as now is not the time to panic. With the average stock in the Russell 1000 Index down over 30% from its high, through Friday 4/4/251, the AAII (American Association of Individual Investors) Survey showing the 3rd highest bearish measure of all time2, record put buying (form of portfolio insurance) on Friday, the NASDAQ new highs vs new lows hitting -1445 (lowest weekly close since the Global Financial Crisis)3, and the VIX (CBOE Volatility Index) spiking to 45, We can create a compelling case that the lion share of the panic has already happened.
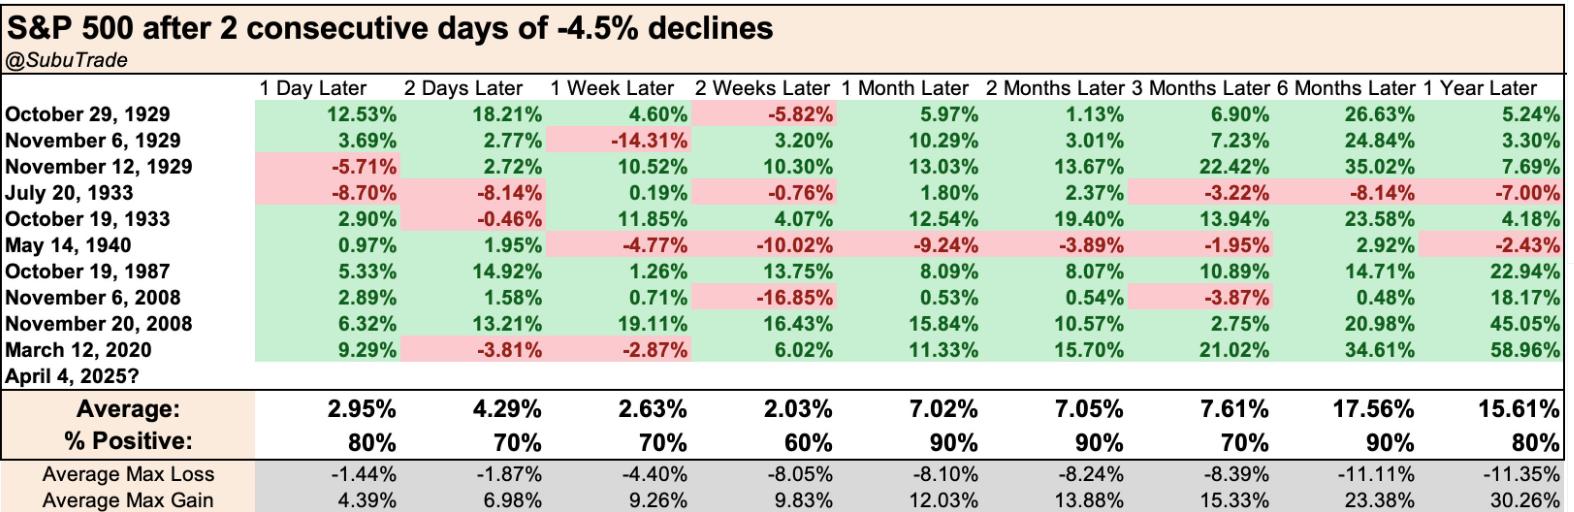
This policy-induced sell-off threatens to lead to a fundamental deterioration of the economy, but despite pessimism existing within the mindset of both businesses and consumers alike, that deterioration is not currently present. At least not yet. Investors need to be prepared for further sharp moves in the market, in either direction, given that policy is exerting so much influence. As no one knows where this bottom settles out, the following chart from Subu Trade helps convey the probabilities around favorable outcomes if one can look out to the next 6 to 12 months, after experiencing a historic few days of declines in financial markets.
The markets had been preparing for the tariff announcements which could be seen through the bouts of volatility in the weeks leading up to “Liberation Day,” as coined by President Trump. The stock market acceleration in its aftermath was a result of the meaningfully high levels and timing around the tariffs. What many felt would be used as a negotiating tool, not only turned into action, but harsher action. Quickly following the inauguration, the administration announced planned tariffs. Heading into last week, many economists and market analysts believed that even if tariffs were implemented, the effective increase in tariffs would be between 10-11%4. After the tariff details last week, assuming all the tariffs are implemented, the effective tariff rate would nearly double that.
When looking at how these tariffs, if implemented in full, will impact the markets from a fundamental point of view we first focus on the outlook for earnings. Goldman Sachs estimates that each additional 5% increase in tariffs could lead to a reduction of S&P 500 earnings by 1-2%5. The consensus estimate for 2025 earnings currently stands at 2686. If the proposed effective tariff rate, of roughly 20%, stays in place, this would result in a reduction of S&P 500 earnings by roughly 4-8%. While this is not a small number, when put into context, despite a reduction in earnings the S&P 500 will still show earnings growth year-over-year, albeit modestly.
In looking at valuations, the US stock market has been trading at an elevated valuation for quite some time. The forward multiple on the S&P 500 has spent the better part of the past two years trading above 20x. Following the 17% pullback over the past few weeks the market is now trading at 19.5x forward for quarter earnings6. This is an improvement but remains slightly elevated from a historical perspective, given the current uncertainties. We could see valuations compress further from here closer to the 10-year historical average of 18.3x7. This leads us to believe the volatility is likely to persist, given the current policy backdrop. Volatility may remain elevated, but the market could move in a rangebound trend as the underlying fundamentals reset. An upside surprise to quarterly earnings is not out of the question, as more companies announce. Corporations have been able to navigate a challenging inflationary environment with near record profit margins. The estimated net profit margin for the S&P 500 in Q1 2025 sits at 12.1%7. Corporate earnings will likely weaken if harsh tariff policy persists, but to what extent is the real question.
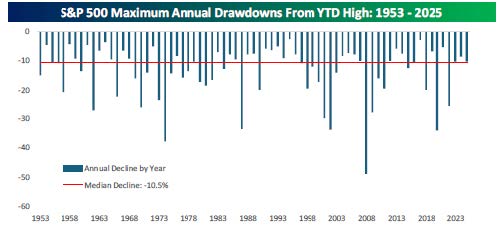
Earnings and valuations matter over the long run and while there could be extended periods of price and fundamental disconnect, mean reversion has historically proven true. The chart below shows the average intra-year decline in the S&P 5008. The recent 17% drawdown exceeds the median decline of 10.5% but remains below recessionary drawdowns.
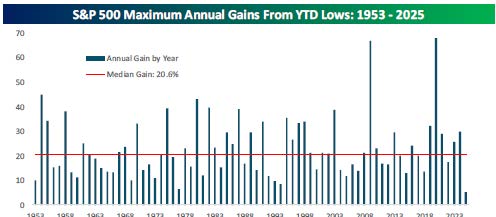
A related chart shows the median gain in the market following a low in any given year8. The median gain of 20.6% highlights the importance of staying committed to your long-term strategic allocations. The headline noise can be difficult to ignore but market pivots quickly and significant returns often follow some of the worst individual days in the market.
Given the uncertainty from tariffs, softening economic data, and what perhaps are early signs of a softening consumer, we believe the market is in a period of recalibration. As long-term investors, we believe establishing strategic allocations that can be committed to for a full cycle is paramount in achieving one’s financial goals.
Sources:
1) Bespoke Investment Group, B.I.G. Tips 4-6-25
2) FS Insight, Mark Newton Daily Technical Strategy 4-4-25
3) Sven Henrich, X 4-5-25 https://x.com/NorthmanTrader/status/1908495388086054962
4) The Budge Lab, Yale University https://budgetlab.yale.edu/research/where-we-stand-fiscal-economic-and-distributional-effects-all-us-tariffs-enacted-2025-through-april#:~:text=Key%20Takeaways&text=The%20average%20effective%20US%20tariff,%25%2C%20the%20highest%20since%201909.
5) Goldman Sachs, https://www.goldmansachs.com/insights/articles/how-tariffs-are-forecast-to-affect-us-stocks
6) LSEG I/B/E/S , https://lipperalpha.refinitiv.com/wp-content/uploads/2025/04/TRPR_82221_794.pdf
7) FactSet Research, Inc https://advantage.factset.com/hubfs/Website/Resources%20Section/Research%20Desk/Earnings%20Insight/EarningsInsight_040425B.pdf
8) Bespoke Investment Group, The Bespoke Report March 14,2025
Important Disclosures:
Investment Advisory Services offered through Krilogy®, an SEC Registered Investment Advisor. Please review all prospectuses and Krilogy’s Form ADV 2A carefully prior to investing. This is neither an offer to sell nor a solicitation of an offer to buy the securities described herein. An offering is made only by a prospectus to individuals who meet minimum suitability requirements.
All expressions of opinion are subject to change. This information is distributed for educational purposes only, and it is not to be construed as an offer, solicitation, recommendation, or endorsement of any particular security, products, or services.
Diversification does not eliminate the risk of market loss. Investments involve risk and unless otherwise stated, are not guaranteed. Investors should understand the risks involved of owning investments, including interest rate risk, credit risk and market risk. Investment risks include loss of principal and fluctuating value. There is no guarantee an investing strategy will be successful. Past performance is not a guarantee of future results. Indices are not available for direct investment; therefore, their performance does not reflect the expenses associated with the management of an actual portfolio. The S&P data is provided by Standard & Poor’s Index Services Group.
Services and products offered through Krilogy® are not insured and may lose value. Be sure to first consult with a qualified financial advisor and/or tax professional before implementing any strategy discussed herein.