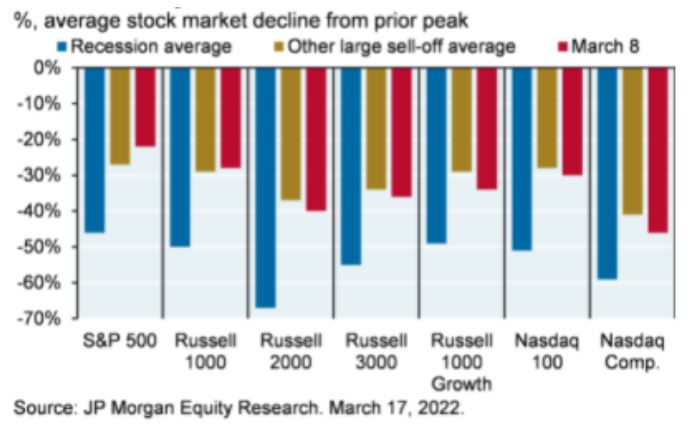
I’d like to provide some color and context around the emerging topic of recession. Before we begin to dive too deeply, I think it’s worthwhile to compare the declines in the stock market this year relative to other historically large sell-offs in non-recessionary periods. As you can observe in this chart from JP Morgan, the low we’ve seen thus far on March 9th represented by the red bar, comes close to meeting and in some instances, exceeding, the large non-recessionary historical market declines for the average stock within most indices. Specifically, the average stock within the S&P is off almost 20% from its 52-week high, and off nearly 50% from the high within the Nasdaq. That is a significant amount of damage that has already been experienced below the surface of many indices.

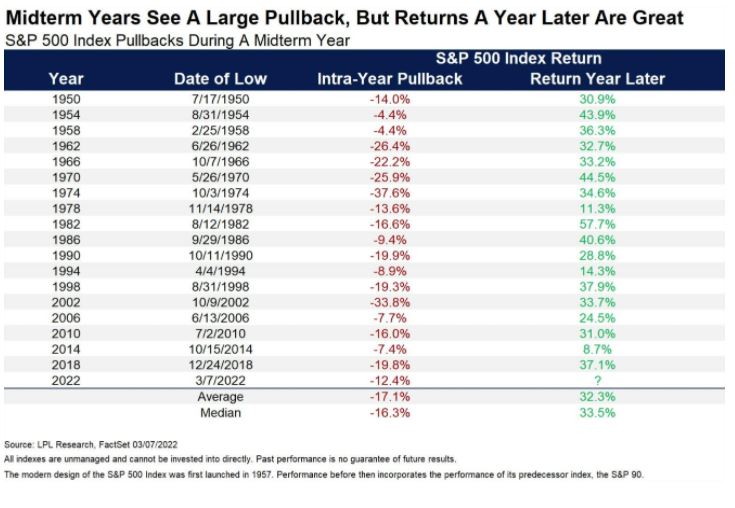
I’d also like to illustrate the normalcy around meaningful mid-term election year market declines. As you can see from these prior 18 mid-term election year declines highlighted by LPL Research, the average decline in the S&P is about 17%. On an intraday basis, thus far, we’ve seen a decline very much in line with this historical norm, of about 14.5%, respectively. In each instance, investors benefitted in sticking to their strategy, as stock market returns one year later saw varying degrees of positive performance.

On to the topic of recessionary risk. It is true we’re experiencing rising energy prices, rising credit spreads, rising wages, supply shortages and a shift in monetary policy by the Fed as they seek to dampen demand through higher interest rates. We’ve also seen a tick down in economic growth and earnings growth expectations. For these reasons, it’s not surprising that the CNBC Fed Survey respondents of Money Managers, economists and strategists has recently measured that nearly one-third of those polled felt the US would enter a recession within the next 12 months. This heightened recessionary view of course differs from Fed Chairman Powell’s perspective as he recently conveyed the probability of a recession within the next year as not being particularly elevated.
While we weren’t in alignment on the Fed’s transitory view on inflation and had positioned portfolios as such, we tend to align our thinking with the Fed Chairman on this particular topic given the overall financial health of the consumer and ultimate slowing of inflationary pressures that should transpire over the course of the year. However, the Fed undoubtedly has a tough task at hand in adjusting policy to combat inflation while not slowing the economy too abruptly.
There still remains what I would consider a potential, if not probable disconnect from what the Fed is forecasting and what actually ends up happening from a policy perspective throughout the remainder of 2022. In fact, through hawkish messaging and just one rate hike thus far, we’ve seen varying demand reducing impacts, such as mortgage rates, move roughly a point and a half since November alone on a 30-year Fixed rate mortgage. This will certainly have an impact on affordability and ultimately demand, in one example of some cooling that is likely to occur. Counter to the fear of an abrupt slowing in economic activity in 2022, we believe that aggregate demand across the economy should remain fairly strong, albeit softening, as the shift in spend normalizes more toward services, as opposed to the pandemic-driven surge in goods spending.
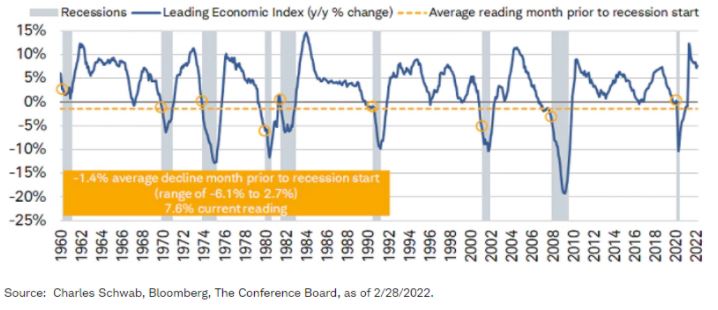
In rounding out some thoughts regarding recessionary risk, many economists and strategists will point to the signals the bond market seems to be warning of, as the spread between the 2-year treasury bond and the 30-year treasury bond is roughly 20 basis points from inversion. Yield curve inversion has historically preceded recessionary periods by roughly 20 months on average going back the last 5 decades. There has also, however, been an example of a false positive in which yield curve inversion was not followed by a recession. Also worth noting, the Year over Year change in the conference board’s index of leading economic indicators has gone negative prior to recessions going back to 1960, and as you can see on this chart from Charles Schwab, the index is still meaningfully positive, even despite having declined from recent highs. There are also many noteworthy examples on this chart that demonstrate the decline in the index that didn’t quite go negative and that were not followed by a recession.

While there certainly isn’t crystal clear visibility as to what the future holds, the guideposts seem to be pointing to a slowing economy amidst demand dampening efforts by Fed Policy that makes a recession risk more possible, but not probable in our opinion at this point. In closing, I’ll leave you with 3 final points: 1) Due to higher inflation, a necessary dampening of demand through Fed Policy does not mean a recession is a probable outcome 2) While lower lows in the market are still possible, there has already been meaningful sell-offs in the average stock in most indices 3) The stock market has priced in an uncomfortable, but yet historically normal, reset in a midterm election year.


