Q4 2024 Review
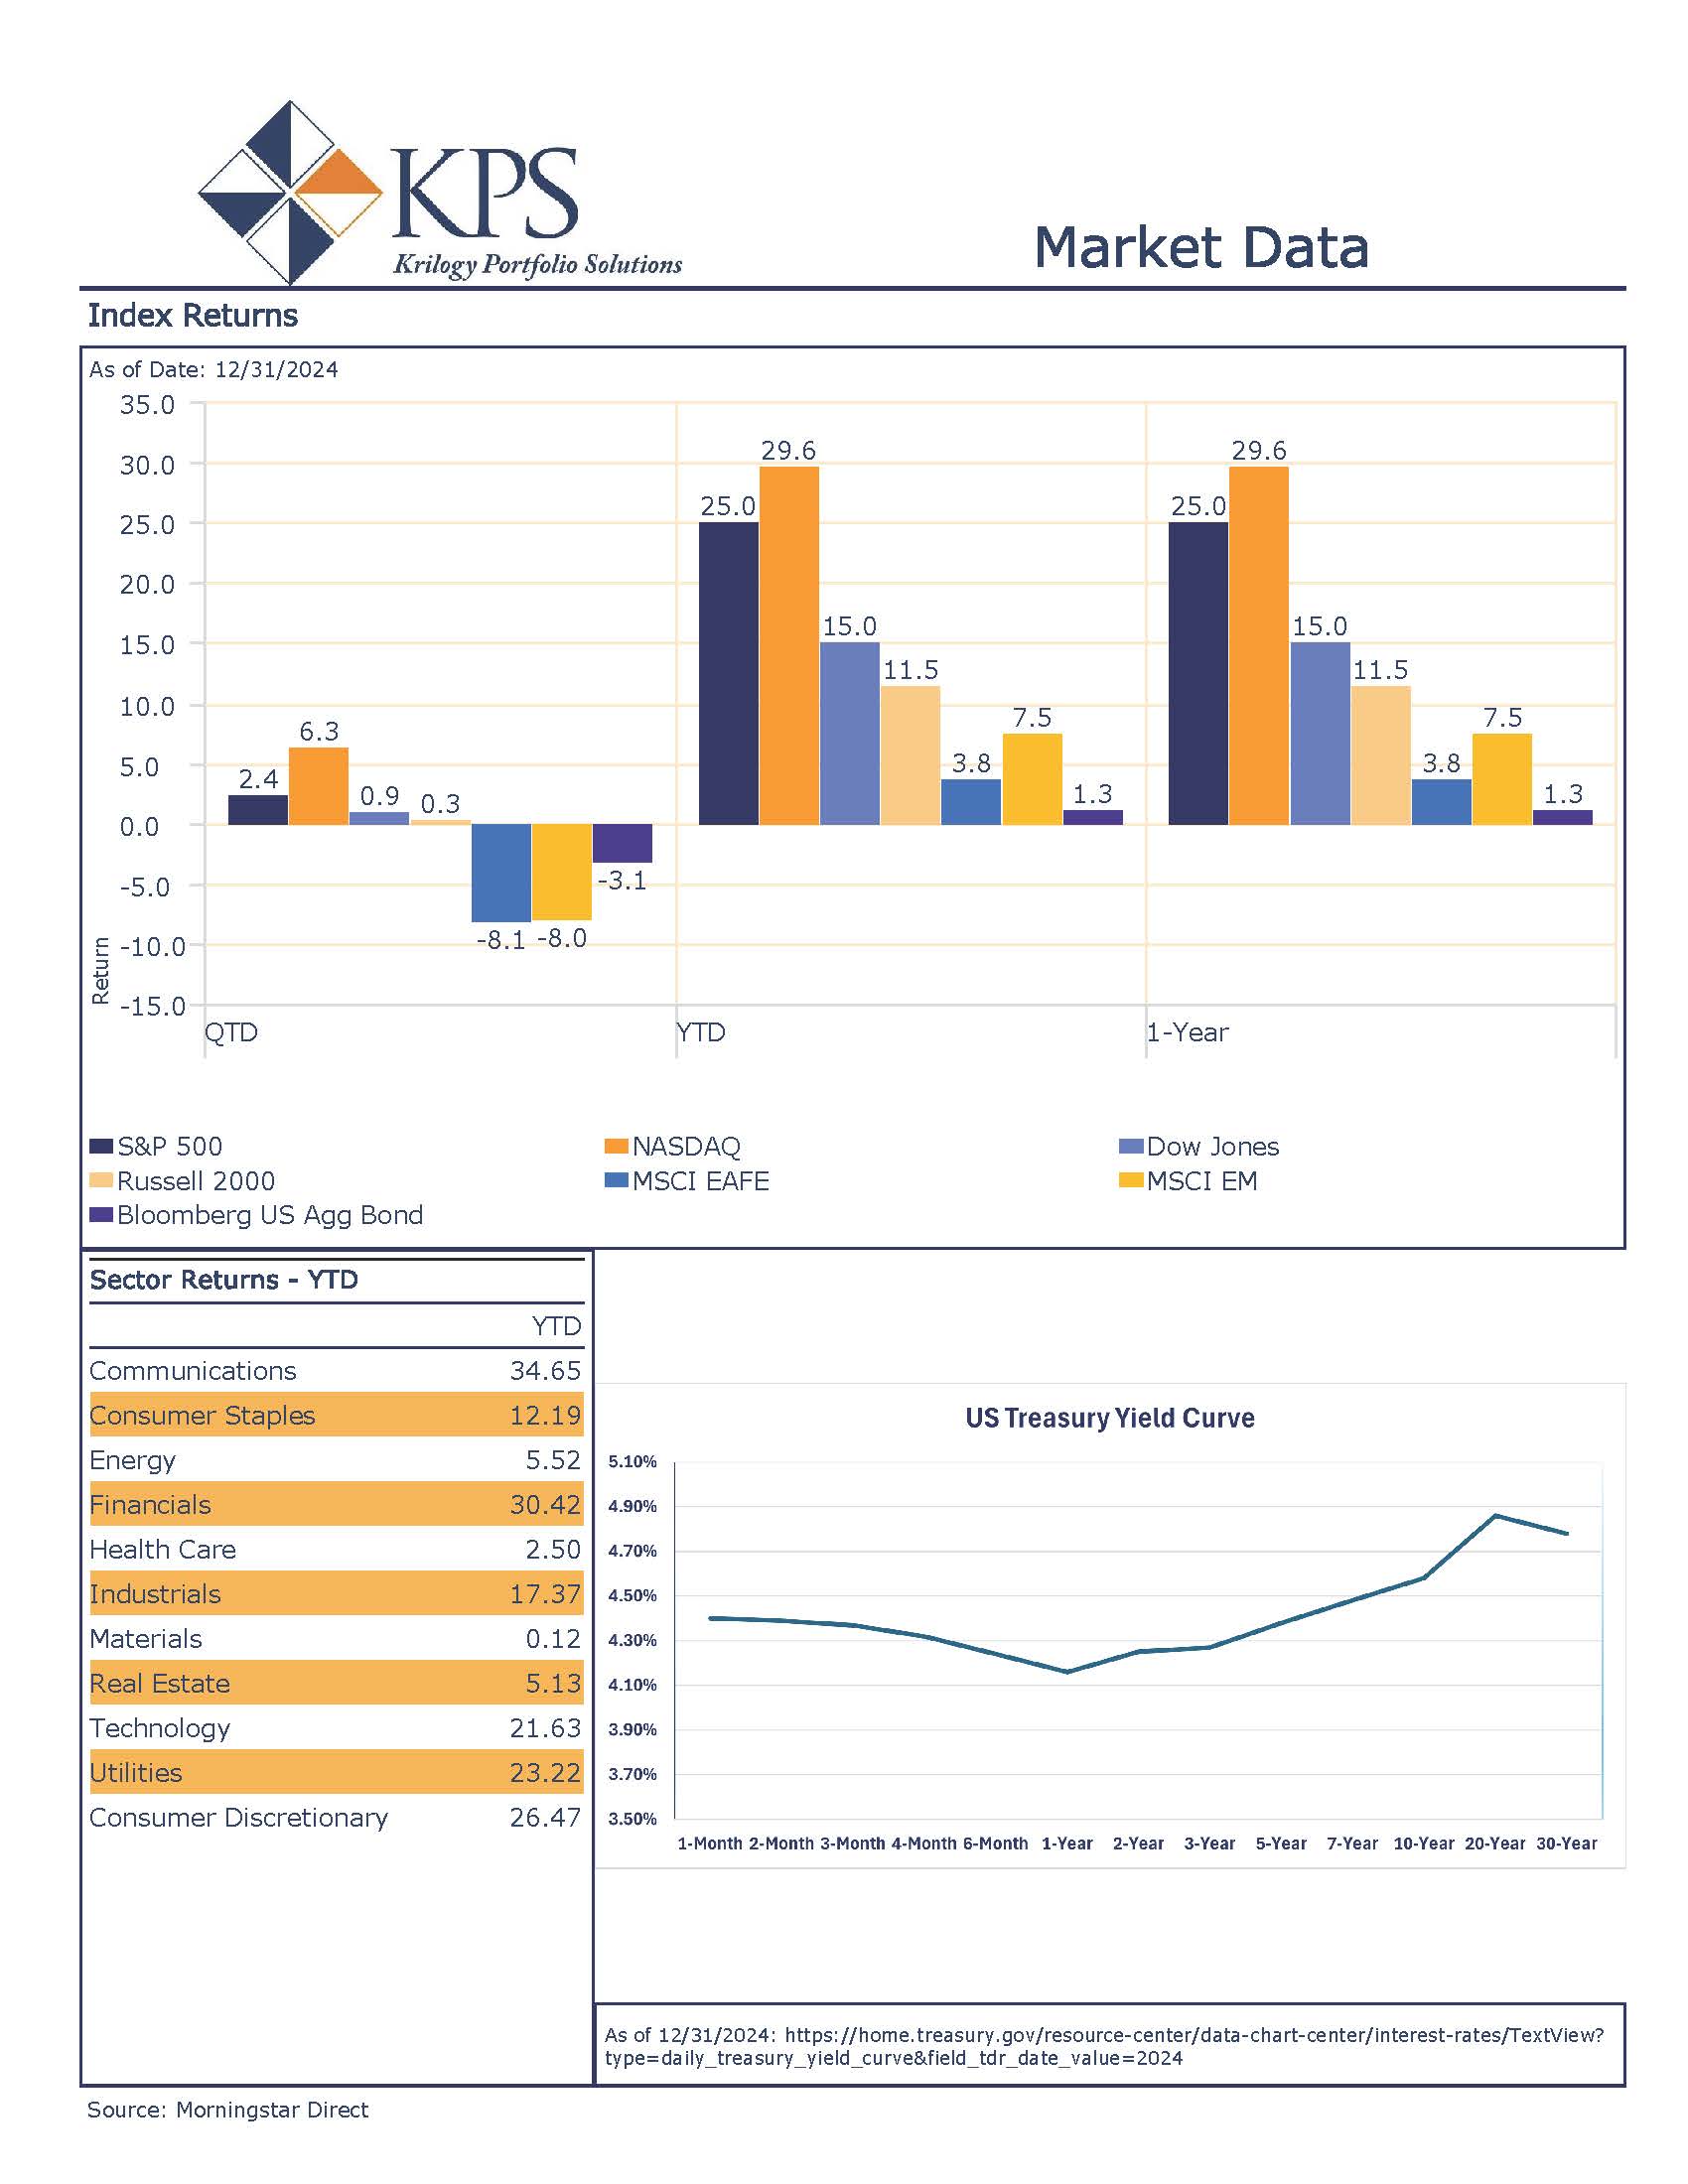
The S&P 500 finished its second consecutive year returning greater than 20%. This feat marks a rare occurrence, which has only occurred four times since 1900[1]. The S&P 500 finished the year up nearly 25%, and once again was outpaced by the NASDAQ which finished up 29.6%. The Dow Jones Industrial Average lagged the other major indices, as a handful of names weighed on return, as it finished up a solid 15%. Market breadth improved in 2024 but remained relatively narrow. In 2024, 145 stocks outperformed the S&P 500[2]. Leadership of the “Mag 7” continued throughout the year as Artificial Intelligence dominated earnings calls and headlines. The chart below from Bespoke Investment Group shows the largest contributors to the index’s performance year-to-date through mid-December[3].
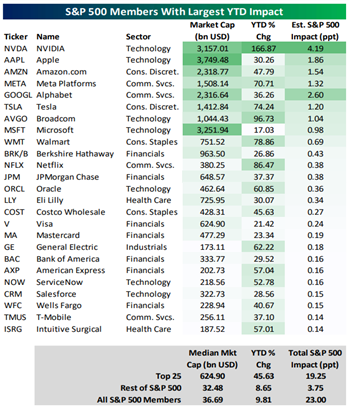 The largest 25 companies in the S&P 500 were responsible for over 80% of the index’s return. Despite the oversized contribution, all S&P 500 sectors ended the year in positive territory. The top-performing sector was Communication Services, returning 34.65%, and the worst performing sector was Materials, eking out a small gain of 0.12%. Financials also had a great year as we saw the yield curve un-invert, returning 30.42%.
The “Magnificent 7” have dominated financial market headlines for well over a year now, along with putting up very strong return numbers. Performance has not certainly been unwarranted. In 2024, the “Mag 7” had earnings growth of 33.3%, while the other 493 companies saw earnings growth of only 4.2%[4]. Earnings growth is projected to slow for the “Mag 7” going forward so the markets will be looking for the rest of the companies to improve on their mediocre results that have occurred the past two years.
Earnings continued to surprise and exceeded analysts’ estimates for the entire year. Earnings growth for the S&P 500 in 2024 was 10.1%[5]. Even though earnings growth was stronger than expected, much of the market rally was fueled by multiple expansion. To close the year, the S&P 500 was trading at 21.5x forward four quarter earnings and peaked above 22x throughout the year. Earnings growth expectations are robust for 2025 and will likely need to come to fruition if we expect to see another strong year of returns.
The fixed income market was volatile throughout the year as market participants were forced to recalibrate their rate cut expectations on multiple occasions. Going into 2024, the market was anticipating 6-7 rate cuts, while only three came to fruition. The Federal Reserve delivered on their expectations laid out for the year as they saw inflation pressures remain throughout the majority of the year. The Bloomberg US Aggregate Bond Index finished the year up a modest 1.3%. The 10-year treasury yield closed the year at 4.575%, up from the 3.86% it closed 2023 at. The steady rise in rates occurred despite slowing inflation and a full 1% rate cut by the Fed. Something very important also occurred in 2024, the inverted yield curve steepened and ended one of the longest yield curve inversions in history. The media focuses on the 2-year/10-year spread, but we believe the 10-yr/3-month treasury spread is more important to focus on in influencing portfolio construction. The chart below shows this relationship dating back to 1967[6].
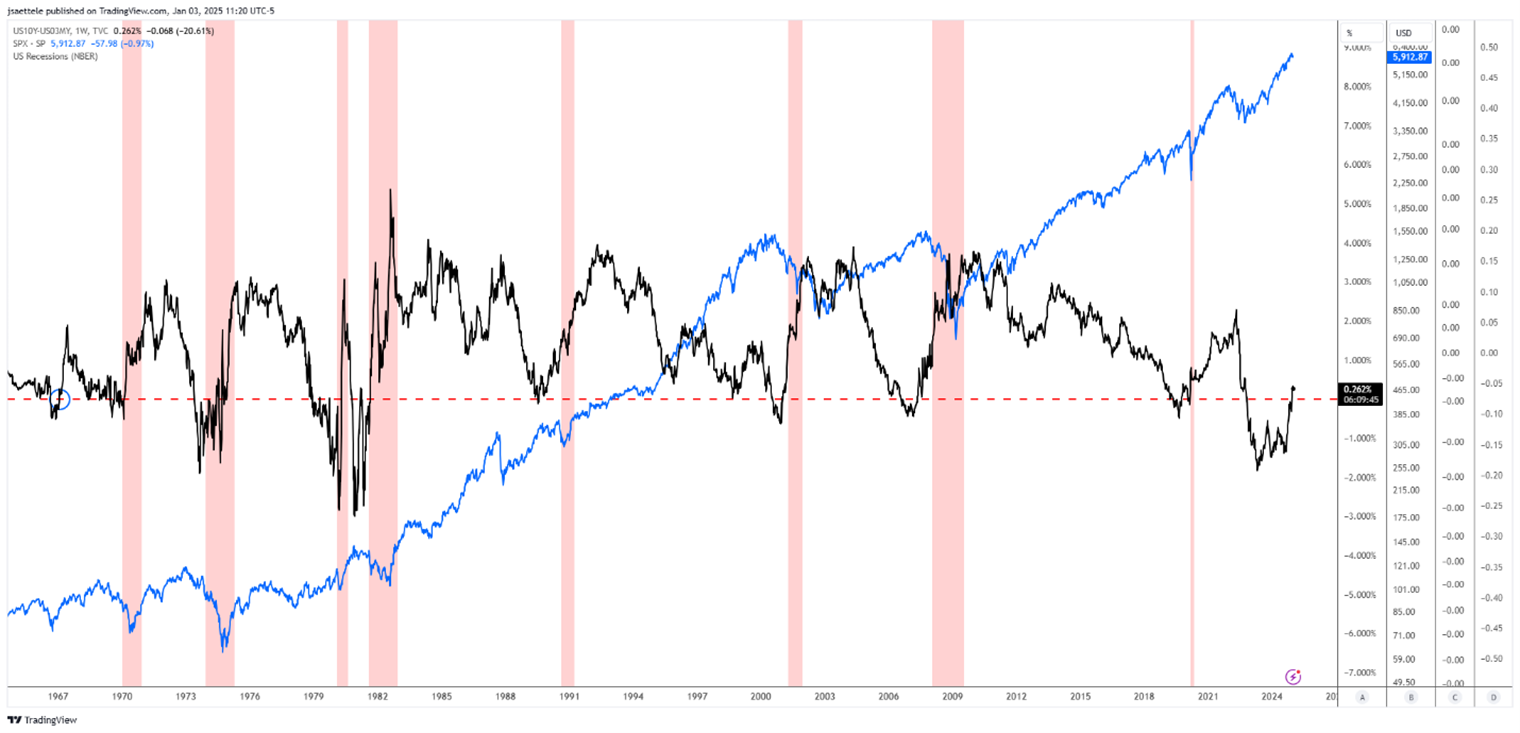
Historically, the un-inversion of the yield curve has occurred prior to an economic slowdown. This is something we have watched closely for multiple quarters and has heightened our probabilities for potential weakness going forward.
Q1 2025 Outlook
Equity Market
The previous two years have seen stellar performance at the index level. We believe there are a few factors that increase the risks of a pullback in the markets at some point in 2025.
- Seasonality
- Market Technicals
- Valuations
Seasonality
Market seasonality can solely be relied upon, but when there are multiple forces at play, we believe investors should remain cognizant of potential impacts. The first quarter post-election has historically been weak[7] and the average bull market’s weakest year, over the past 50 years, has been its third year, with an average return of only 6%[8]. If you combine both of these seasonal components, it increases our belief that the markets are likely to experience a period of weakness in 2025.
Market Technicals
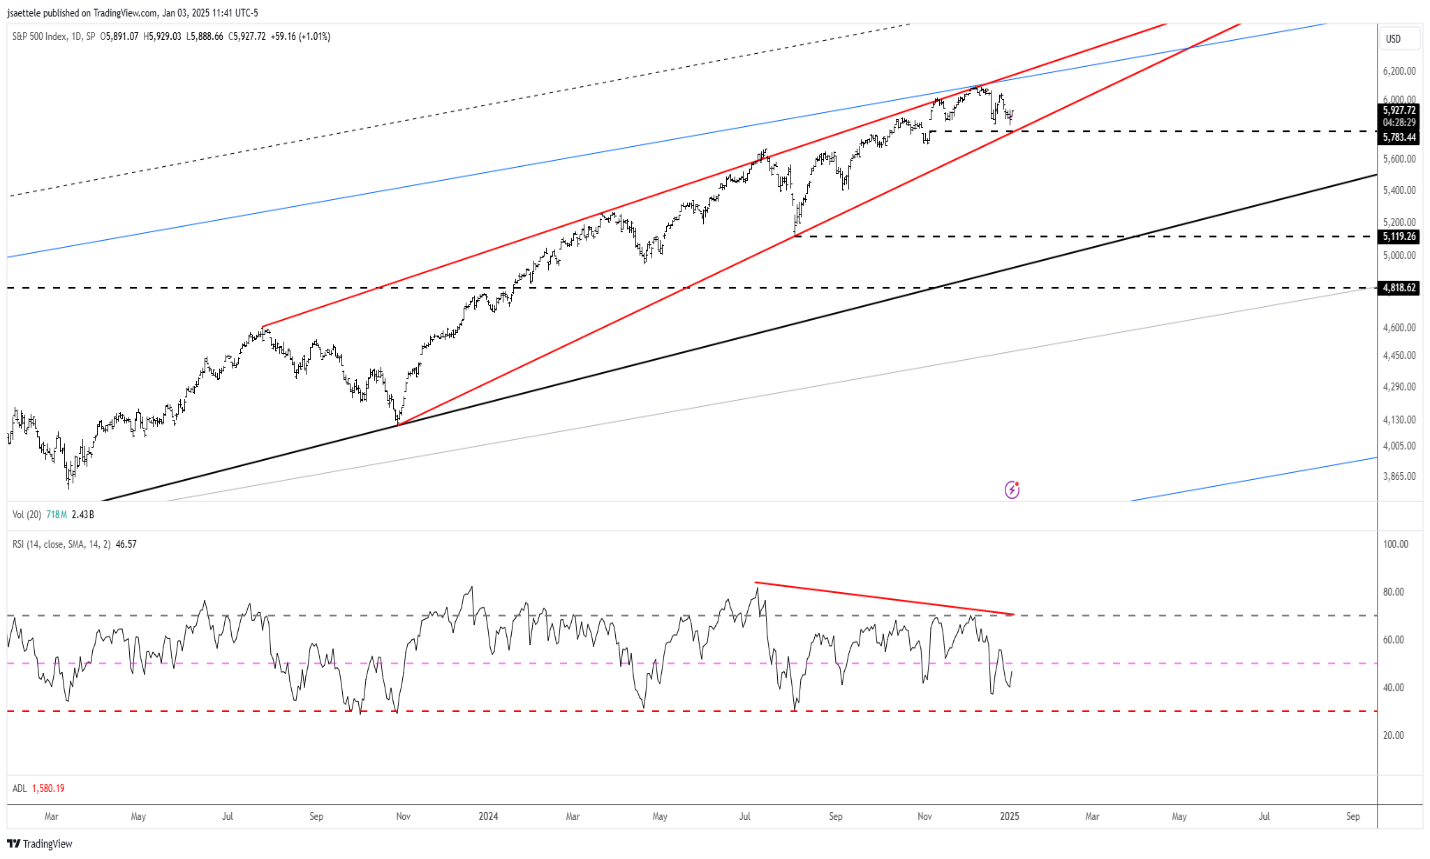
The chart below shows the consistent rally from the October 2023 lows[9]. We are looking at the pattern of the rise though, which is forming a wedge pattern. This pattern implies slowing momentum in the market which could be an indication of being in the latter stages of a bull market. This “wedge” indicates each leg of a rally is weaker than its last. Slowing momentum is a hallmark of late stage bull markets and is a reason why many bull markets end with a wedge pattern.
Valuations
In the short-run, we acknowledge valuations have little explaining power in expected returns. But, as long-term investors, we believe it is prudent to pay attention because of their long-term predictive power of expected returns and their impact on short-term market sentiment. We believe valuations can be ignored until they get too far out of hand to justify. Historically, valuations have significant explanatory power of expected multi-year returns (10 years+), which can be seen in the chart below from Bank of America[10].
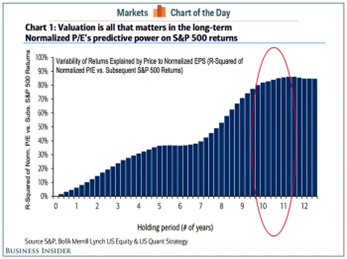 According to this research, over 80% expected return can be explained by the valuations at the time of purchase. If an investor purchases an asset at a high price, the expected return is lower. The current normalized multiple of the S&P 500 stands at 37x[11]. Normalizing entails taking a long-run average to smooth out short term spikes and declines. The current valuation is what we consider elevated but is yet to reach extreme levels like the market experienced prior to the dot.com crash 2000. This leads us to believe the market is exposed to a “re-set”.
Combining these three factors, seasonality, market technicals, and valuations, we believe the market is vulnerable for an increase in volatility and potential pullback. In 2024, the largest decline was a minor 9.71% that lasted only a couple of weeks. The average intra-year decline has been 14%[12] so we see an increased likelihood following two years of a strong performance and accompanied the majority of the time with low volatility.
Fixed Income Market
Our view of the fixed income market remains positive heading into 2025. We believe investors that have a fixed income allocation should be well compensated as yields remain at attractive levels. We believe investors should recalibrate their expectations for the next fixed income cycle, however. Unlike the 40+ year bull market in bonds where capital appreciation enhanced returns, we believe returns from fixed-income will be comprised of the “income” component. Currently, the Fed Fund’s Futures market is pricing in between two and three rate cuts this year[13]. This aligns with the Federal Reserve’s outlook, and is the first time in multiple years the market has not had very different expectations. For this reason, we believe volatility should be more subdued when compared to the prior two years in the bond market.
We do have an opinion that differs slightly from the broader markets. We believe we could see rates remain elevated throughout the year, and potentially push closer to 5% for a short period. The chart below shows historical inflation periods compared to the most recent bout of inflation[14].

There has been a historical pattern for three waves of inflation. The current trend is following very closely to the 1960-1980 period. While the level of inflation is drastically different from that period, there could be another round of inflation pressures that could keep rates elevated for a longer-period of time. This would align with the Fed’s “higher for longer” mantra. We do not see rates pushing past the prior high of 5%, we do see the possibility for short term fluctuations near that level.
Conclusion
As we move into the new year, we believe investors should review their portfolios to ensure their allocations align with their long-term strategic returns which was created to reach their investing goals. Following years of concentrated performance, investors could have over exposure to risk they may not be aware of that could significantly impact their portfolios when the market experiences a corrective move. We also believe implementing a dynamic rebalancing program which takes the emotion out of portfolio re-allocation decisions can help mitigate unwanted risks and quick reactions to market pullbacks. Dynamic rebalancing also ensures that your allocations remain diversified and align with your long-term risk and return objectives.
At Krilogy®, we are committed to helping you effectively navigate the ever-changing market environment. As long-term investors, we believe it is critical to remain patient and stick to the plan that was developed for your unique situation to arrive at a personal allocation target. Our entire team remains dedicated to helping you achieve your financial goals.
Sources
[1] JP Morgan Asset Management, https://am.jpmorgan.com/content/dam/jpm-am-aem/americas/us/en/insights/market-insights/wmr/weekly_market_recap.pdf
[2] KPS Research, Morningstar Direct
[3] Bespoke Investment Group, https://www.bespokepremium.com/interactive/posts/think-big-blog/concentration
[4] FactSet Research Inc., https://insight.factset.com/sp-500-cy-2025-earnings-preview-analysts-expect-earnings-growth-of-15
[5] LSEG I/B/E/S, https://lipperalpha.refinitiv.com/wp-content/uploads/2025/01/TRPR_82221_781.pdf
[6] KPS Research, Trading View
[7] AlmanacTrader, “Four-Year Presidential Election Cycle Midterm Year Weak & Sweet Spot”
[8] BMO Capital Markets Investment Strategy Group, “S&P 500 Average Return By Bull Market Year”
[9] KPS Research, Trading View
[10] BofA Merrill Lynch US Equity & US Quant Strategy, https://www.businessinsider.com/baml-single-most-important-determinant-long-term-returns-sp-500-pe-2015-11
[11] Mutlipl, https://www.multpl.com/shiller-pe
[12] JP Morgan Asset Management, https://am.jpmorgan.com/us/en/asset-management/adv/insights/market-insights/guide-to-the-markets-old/guide-to-the-markets-slides-us/equities/gtm-annualreturns/
[13] CME Group, https://www.cmegroup.com/markets/interest-rates/cme-fedwatch-tool.html
[14] KPS Research, Trading View
Important Disclosures
Investment Advisory Services offered through Krilogy®, an SEC Registered Investment Advisor. Please review all prospectuses and Krilogy’s Form ADV 2A carefully prior to investing. This is neither an offer to sell nor a solicitation of an offer to buy the securities described herein. An offering is made only by a prospectus to individuals who meet minimum suitability requirements. All expressions of opinion are subject to change. This information is distributed for educational purposes only, and it is not to be construed as an offer, solicitation, recommendation, or endorsement of any particular security, products, or services. Diversification does not eliminate the risk of market loss. Investments involve risk and unless otherwise stated, are not guaranteed. Investors should understand the risks involved of owning investments, including interest rate risk, credit risk and market risk. Investment risks include loss of principal and fluctuating value. There is no guarantee an investing strategy will be successful. Past performance is not a guarantee of future results. Indices are not available for direct investment; therefore, their performance does not reflect the expenses associated with the management of an actual portfolio. The S&P data is provided by Standard & Poor’s Index Services Group. Services and products offered through Krilogy® are not insured and may lose value. Be sure to first consult with a qualified financial advisor and/or tax professional before implementing any strategy discussed herein.


