Q2 2024 Review
Click to View PDF
Equity Market
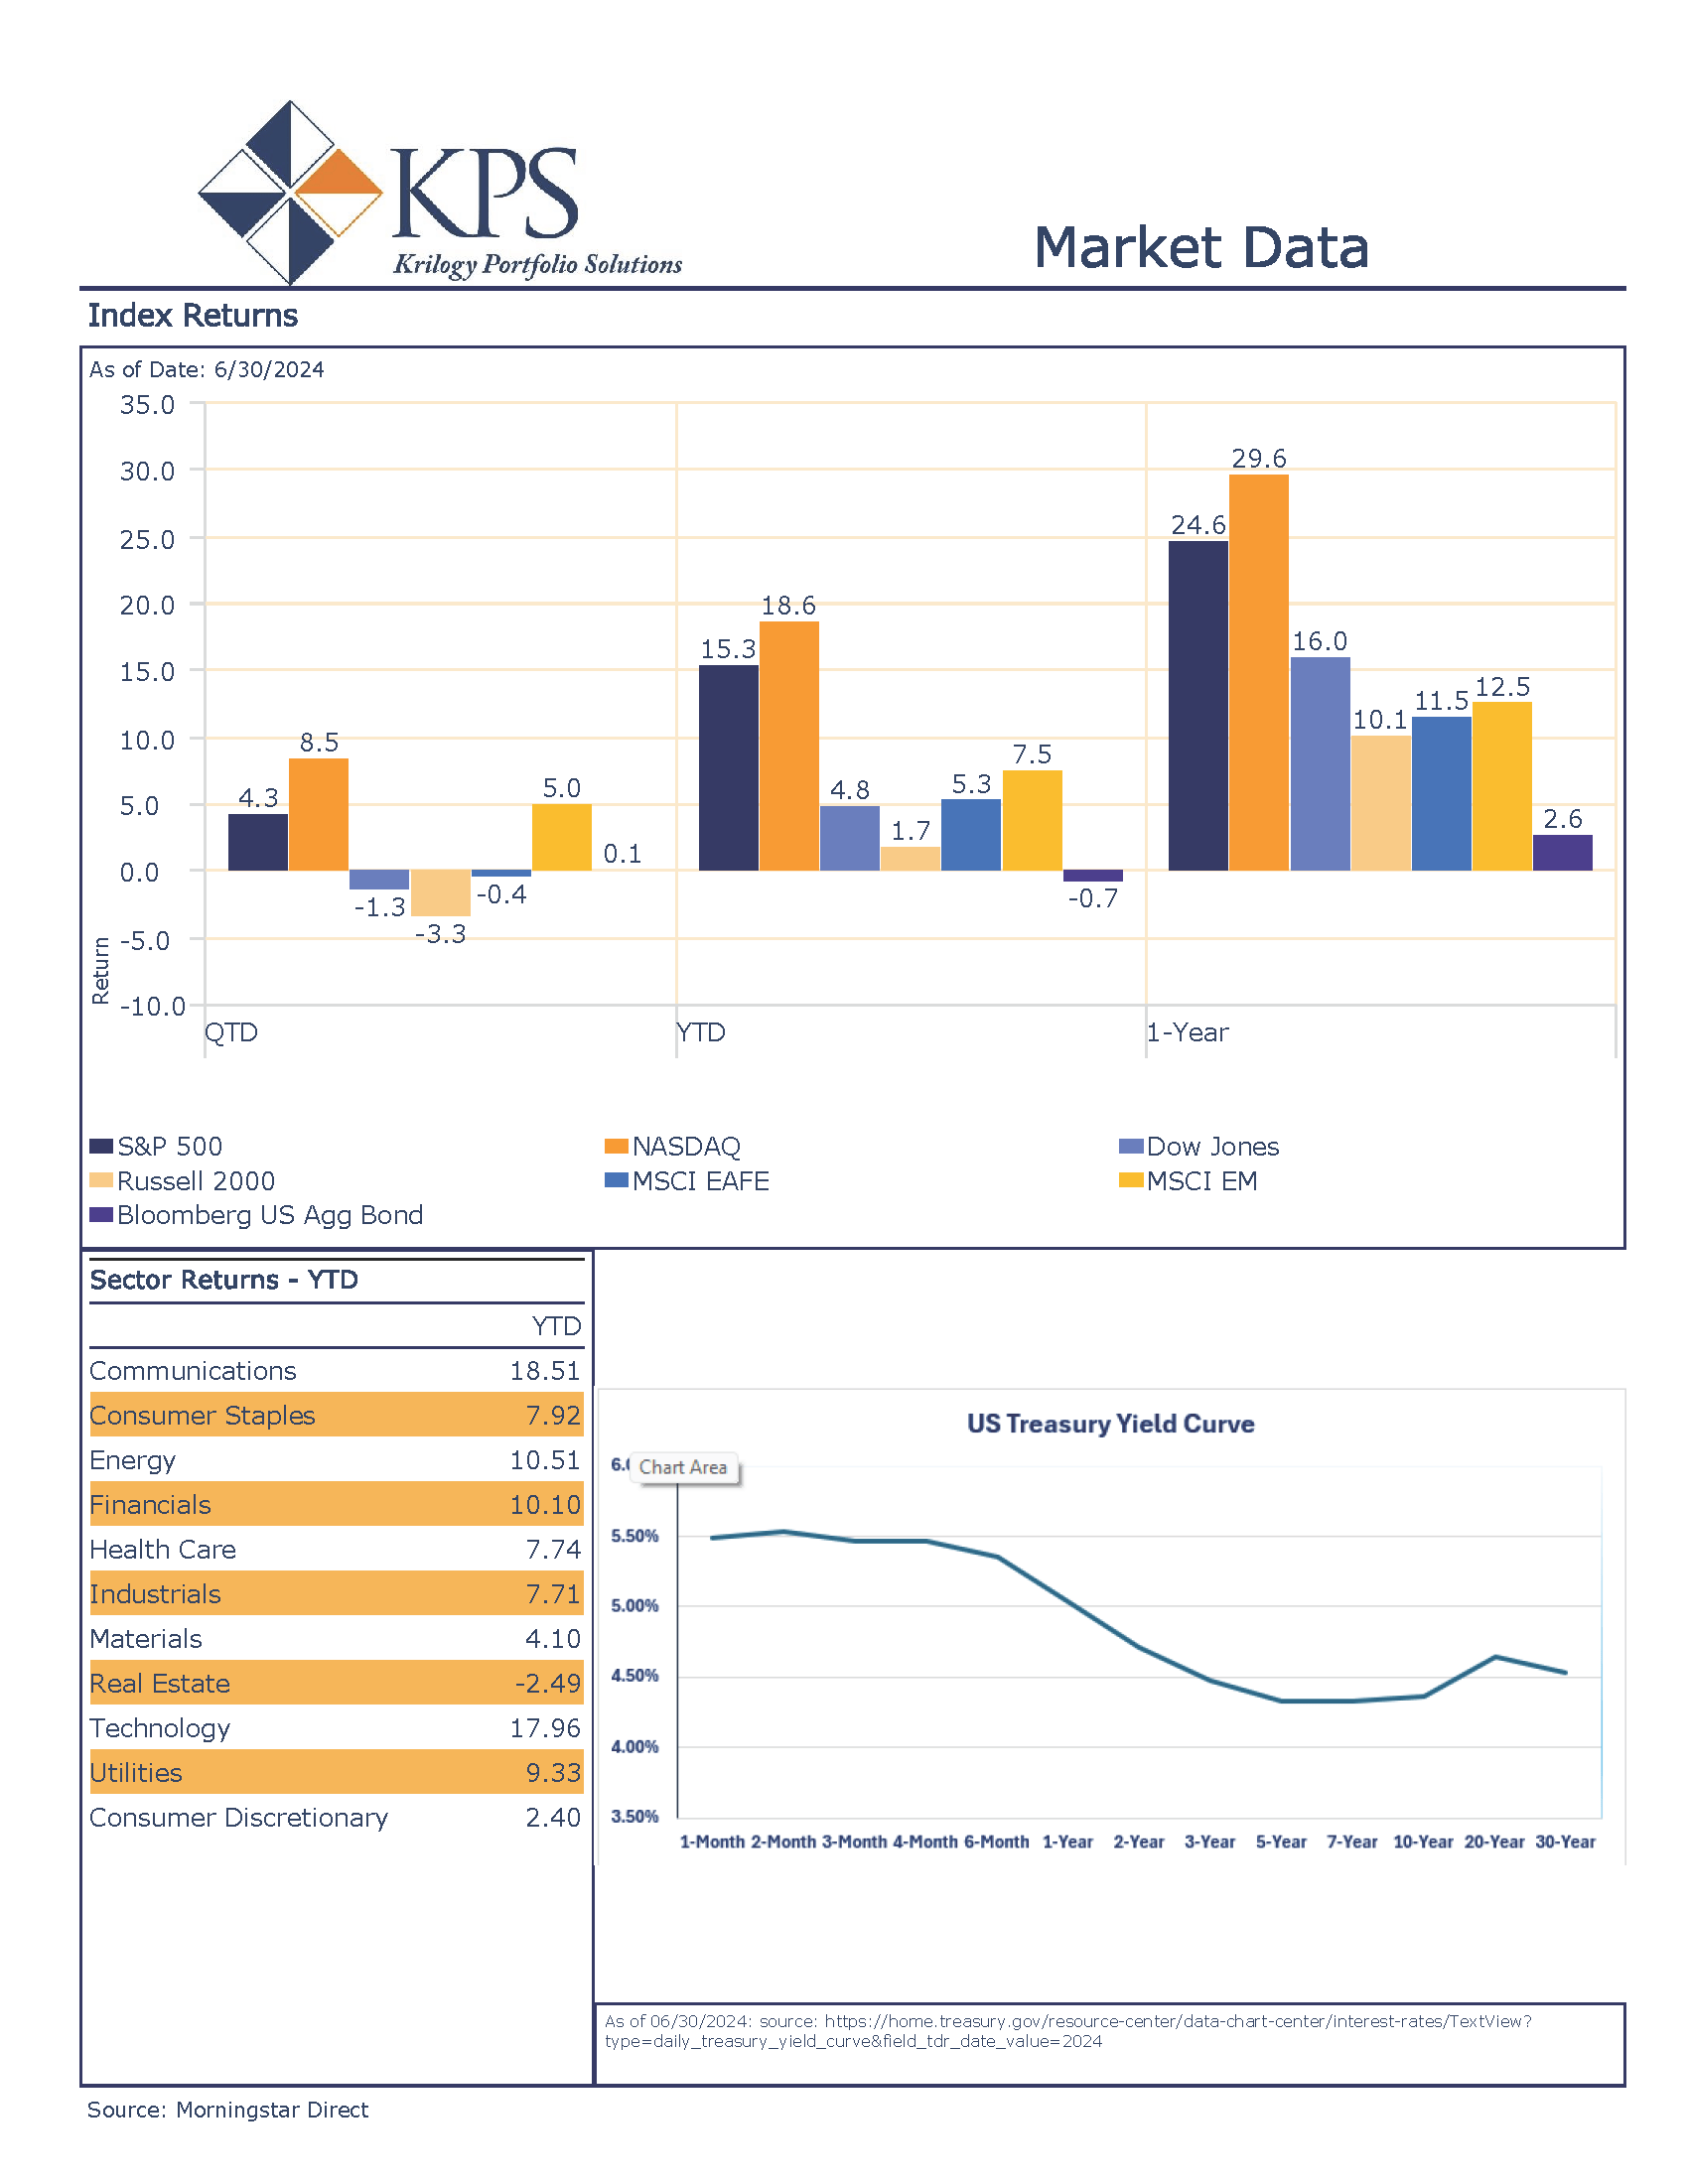
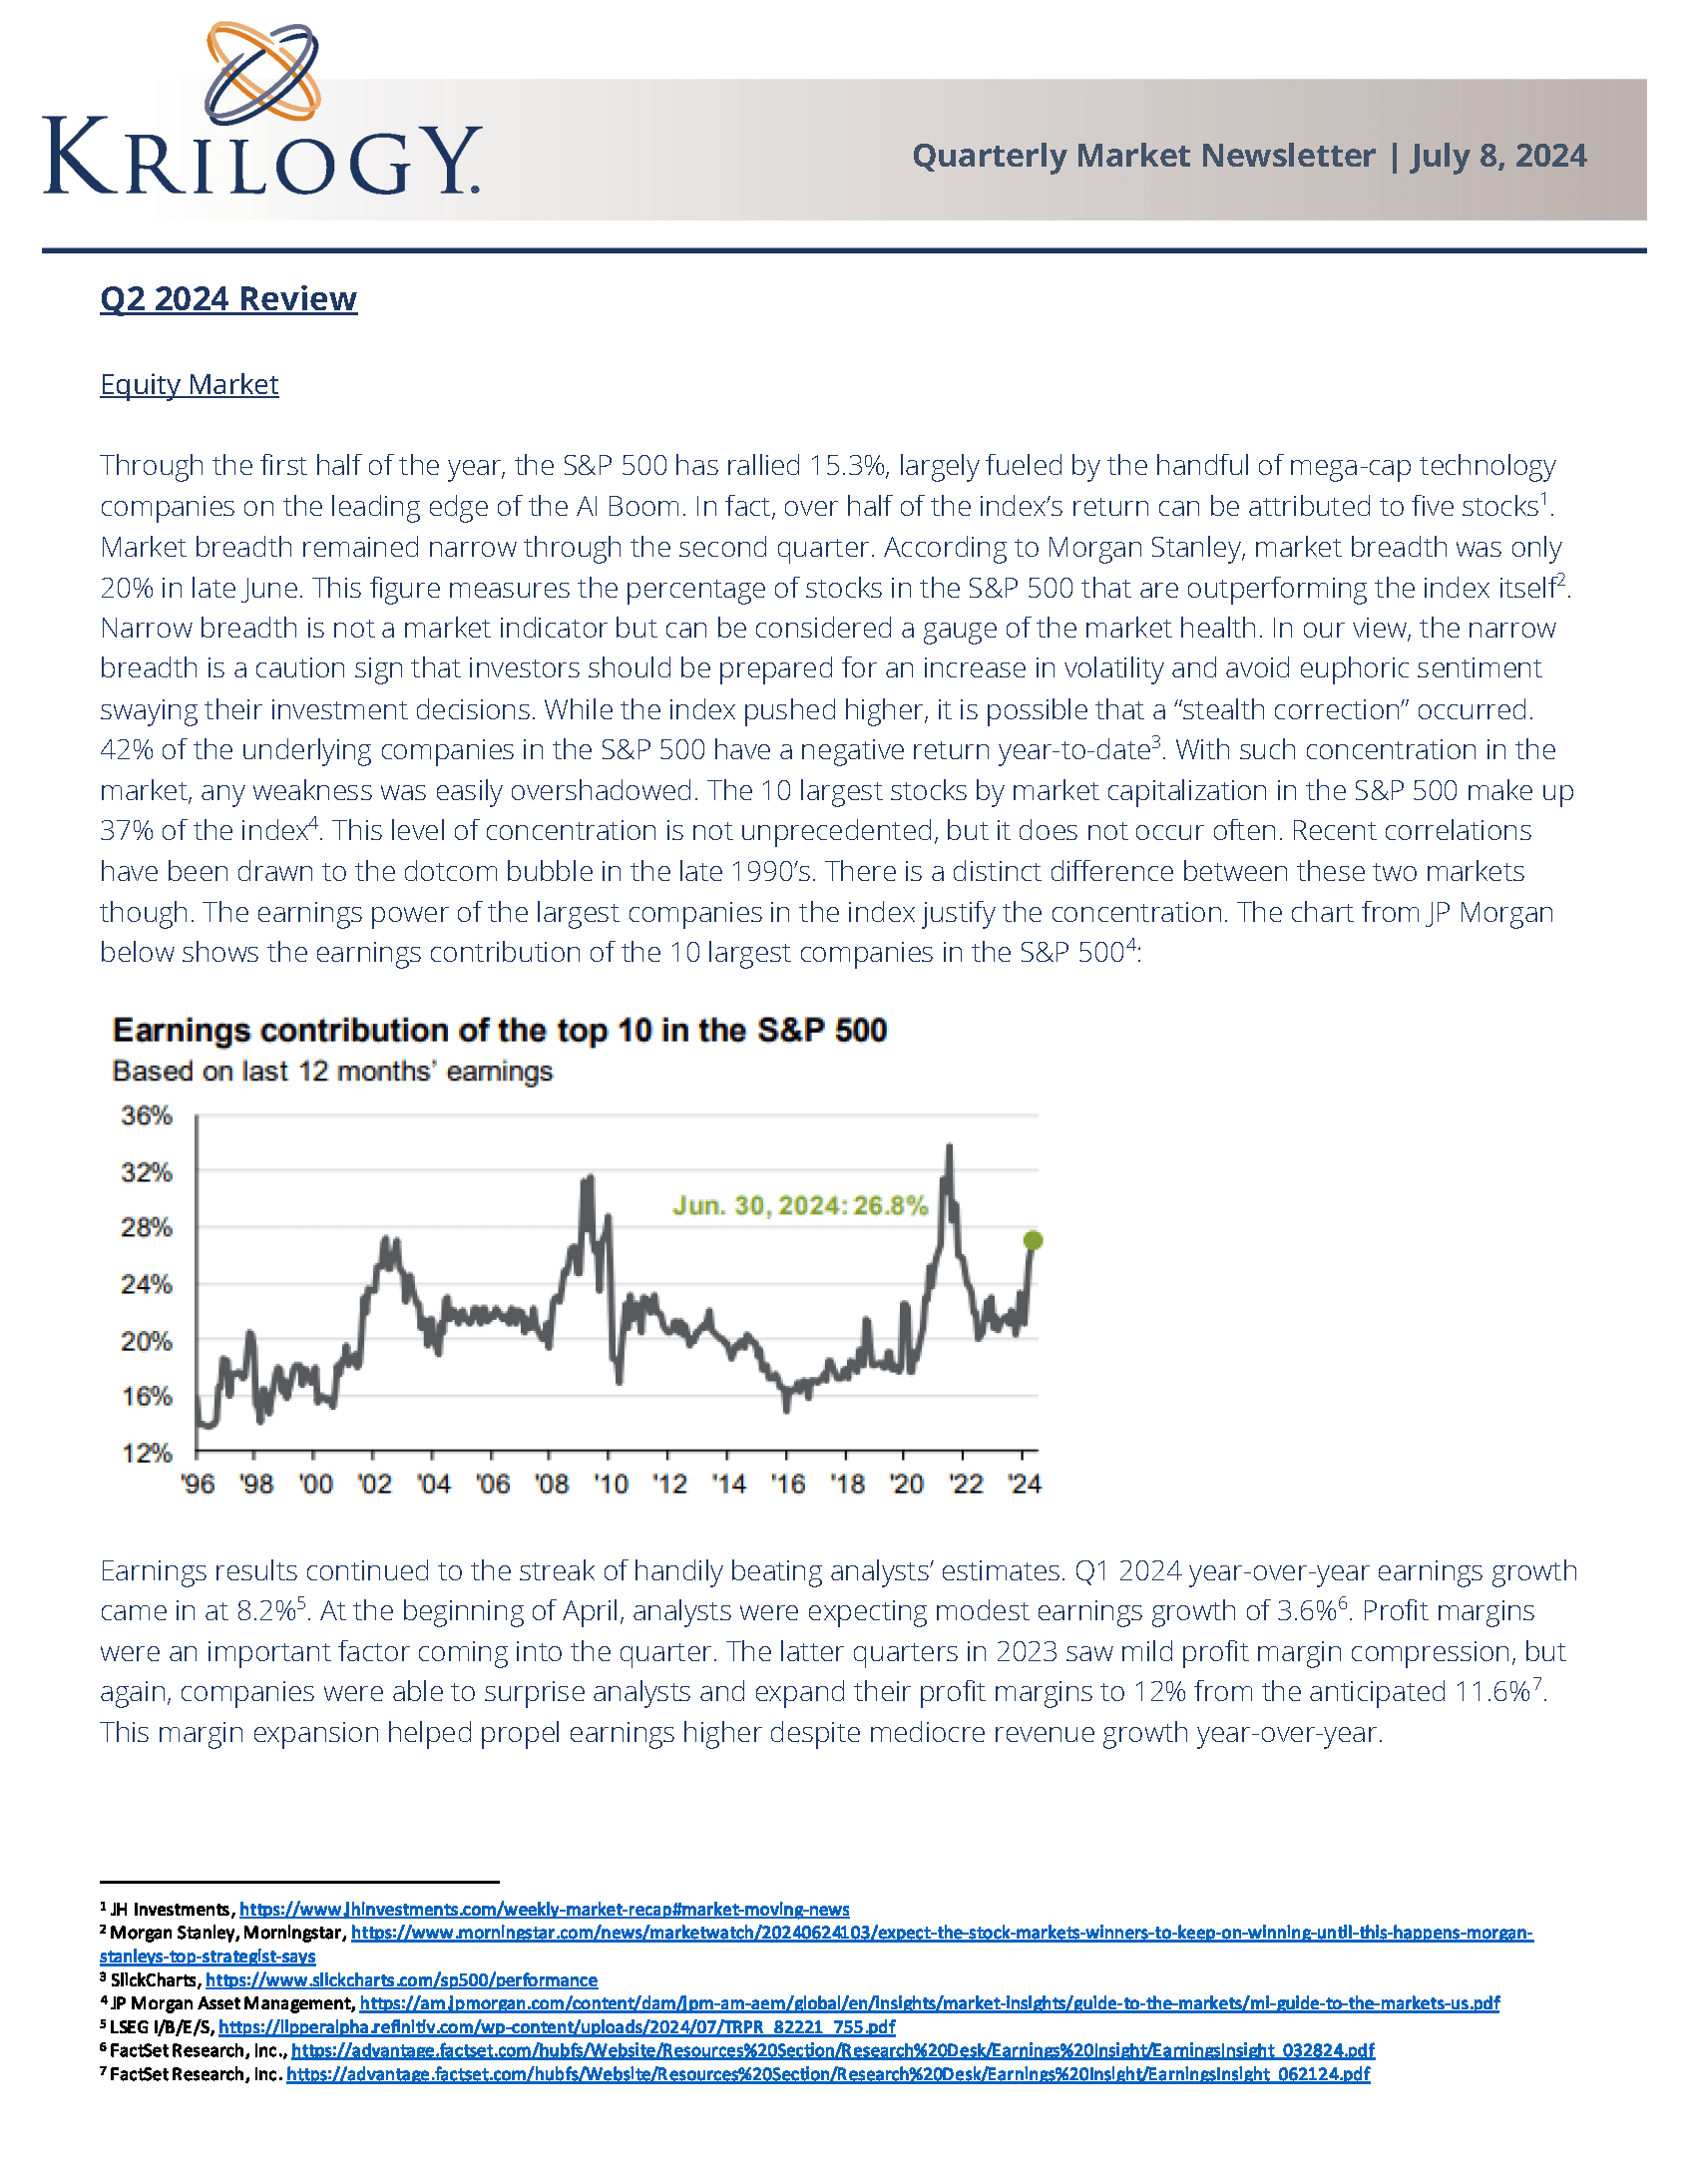
Through the first half of the year, the S&P 500 has rallied 15.3%, largely fueled by the handful of mega-cap technology companies on the leading edge of the AI Boom. In fact, over half of the index’s return can be attributed to five stocks[1]. Market breadth remained narrow through the second quarter. According to Morgan Stanley, market breadth was only 20% in late June. This figure measures the percentage of stocks in the S&P 500 that are outperforming the index itself[2]. Narrow breadth is not a market indicator but can be considered a gauge of the market health. In our view, the narrow breadth is a caution sign that investors should be prepared for an increase in volatility and avoid euphoric sentiment swaying their investment decisions. While the index pushed higher, it is possible that a “stealth correction” occurred. 42% of the underlying companies in the S&P 500 have a negative return year-to-date[3]. With such concentration in the market, any weakness was easily overshadowed. The 10 largest stocks by market capitalization in the S&P 500 make up 37% of the index[4]. This level of concentration is not unprecedented, but it does not occur often. Recent correlations have been drawn to the dotcom bubble in the late 1990’s. There is a distinct difference between these two markets though. The earnings power of the largest companies in the index justify the concentration. The chart from JP Morgan below shows the earnings contribution of the 10 largest companies in the S&P 500:
Earnings results continued to the streak of handily beating analysts’ estimates. Q1 2024 year-over-year earnings growth came in at 8.2%[5]. At the beginning of April, analysts were expecting modest earnings growth of 3.6%[6]. Profit margins were an important factor coming into the quarter. The latter quarters in 2023 saw mild profit margin compression, but again, companies were able to surprise analysts and expand their profit margins to 12% from the anticipated 11.6%[7]. This margin expansion helped propel earnings higher despite mediocre revenue growth year-over-year.
Fixed Income Market
The lack of volatility in the equity markets did not translate to the bond market. At the beginning of the quarter, the 10-year Treasury Yield was 4.32% and finished the quarter modestly higher at 4.39%. But the intra-quarter path saw the 10-yr reach as high as 4.74% in late April before falling to 4.18% in early June. The jump in rates was caused by hot inflation and labor market reports. The markets began the year pricing at least six rate cuts for 2024, while policymakers indicated the possibility of only three. Bond market participants had to recalibrate their expectations which caused high levels of short-term volatility. At the end of the quarter, the Fed Fund’s Futures Market has priced in between one and two rate cuts this year[8].
Economic
The Federal Reserve continues down its originally stated policy path and will not cut rates until it sees continued improvement in inflation down to its 2% target level. The Fed’s preferred inflation gauge, the Personal Consumption Expenditures Index (PCE) was released on the last day of the quarter. On an annual basis, the index rose 2.6%. This marks a significant improvement from the June 2022 high of 7.1% but remains too high for policymakers[9]. The labor market remains strong, but recent reports have shown a slight softening. Broadly speaking, recent economic numbers have slowed but remain positive which keeps in play the “soft landing” scenario that the Federal Reserve has hoped for.
Q3 2024 Outlook
Equity Market
After a significant first-half run by the markets, which was highly concentrated, we see a greater potential for the return of volatility. Two of the factors that weigh heavily on our view is the narrow market breadth and the presidential election. As we noted in our review of the second quarter, narrow market breadth is not an indicator but more of a gauge. If inflation continues to cool and  rates keep declining, there is the potential for market breadth to widen and would provide significant tailwinds for a second-half rally in the markets. The potentially down scenario would lack breadth expansion and the market leaders experience weakness. The S&P 500 has reached a natural resistance level, which can be seen in the chart on the left[10], which correlates with February 2024 and July 2023 highs.
An increase in volatility does not necessarily mean the markets will see a significant drawdown, but the largest pullback this year has only been 5%, and we do not believe that trend will continue through the end of the year. In our opinion, Presidential elections and/or outcomes have a long-term impact on the markets, but we do acknowledge the short-term disruptions it can cause. The uncertainty surrounding this year’s election only increases the potential for contributing to higher volatility.
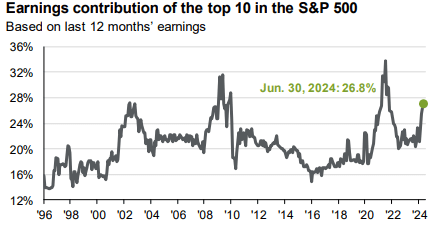
As long-term investors, we acknowledge the short-term market environment and try to navigate it accordingly, but the core of our portfolio allocations are built for full market cycles. We believe valuations are the most important determinant for long-term expected returns. Currently, the S&P 500 is trading at 21x forward four-quarter earnings. While this is not at extreme levels, we do believe investors should mindful of the price their paying to own public companies. The charts below from JP Morgan show subsequent 1-year (the chart on the left) and subsequent 5-year annualized return (the chart on the right) of the S&P 500 based on the valuation level at time of purchase[11].
The red dot is where the S&P 500 finished the quarter. Valuations have little predictive power on a 1-year basis, as you can see in the chart on the left, but the correlations between valuation and multi-year returns (in this case 5-years), are significantly higher. At current levels, we believe the markets are optimistically priced and is not priced that takes into account any economic weakness over the next year. We would consider this to be a time to evaluate your current allocations to ensure that you do not have overconcentration and that it aligns with your thoughtfully developed target allocations to meet your long-term investing goals.
Fixed Income Market
The environment has been tough for fixed-income investors for over two years. Thankfully, we believe there is an end in sight. It is very likely the Federal Reserve will cut rates at least one time this year and we believe now that the market has re-aligned with the policymaker’s outlook, we will see lower volatility in the bond market for the remainder of the year. Our long-term opinion remains positive for the bond market. Investors still have great options to obtain yields significantly higher than in the previous cycle. The chart below from Blackrock shows current yields relative to their 10-year average[12].
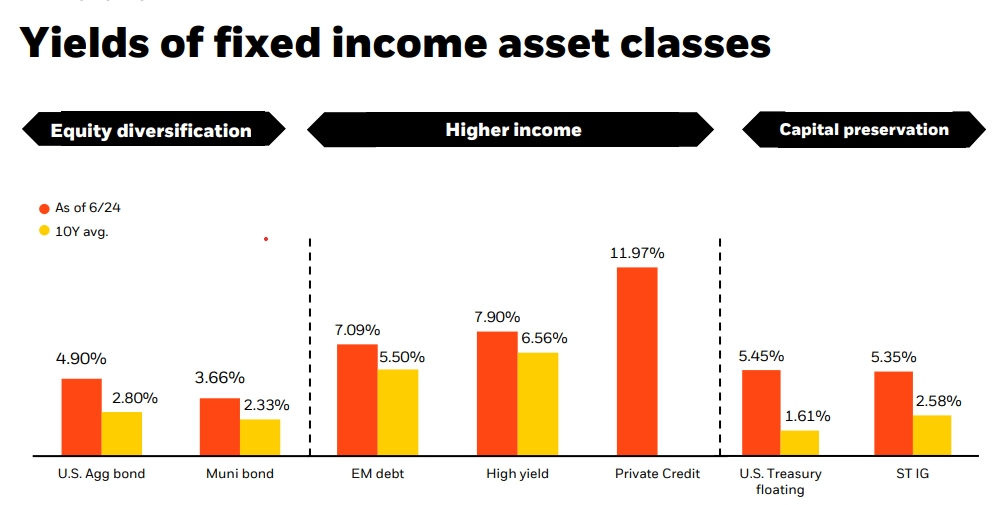 Unlike the previous cycle, fixed-income investors do not have to reach out in maturity or down in credit quality to receive, in our minds, sufficient yields. Considering the risk/reward relationship in the fixed-income markets, we see a significant skew. If the yield curve moves 1% higher, the 10-year Treasury would only fall 3.5%, but a 1% move lower would see a total return for the 10-year Treasury of 12.3%. It is important to note that bond prices are inversely related to interest rates. When interest rates fall, bond prices go up.
Conclusion
The AI craze has propelled the markets higher, while some of the excitement is justified, we also believe sentiment is stretched and increases the risk of a pullback. Investors should use times like market highs, to thoroughly evaluate their allocations to ensure they align with their long-term investment goals. We also believe that a systematic rebalancing program can help take the emotion of decision-making and keep portfolio risk exposure to desired levels.
At Krilogy®, we are committed to helping you effectively navigate the ever-changing market environment. As long-term investors, we believe it is critical to remain patient and stick to the plan that was developed for your unique situation to arrive at a personal allocation target. Our entire team remains dedicated to helping you achieve your financial goals.
Sources
[1] JH Investments, https://www.jhinvestments.com/weekly-market-recap#market-moving-news [2] Morgan Stanley, Morningstar, https://www.morningstar.com/news/marketwatch/20240624103/expect-the-stock-markets-winners-to-keep-on-winning-until-this-happens-morgan-stanleys-top-strategist-says [3] SlickCharts, https://www.slickcharts.com/sp500/performance [4] JP Morgan Asset Management, https://am.jpmorgan.com/content/dam/jpm-am-aem/global/en/insights/market-insights/guide-to-the-markets/mi-guide-to-the-markets-us.pdf [5] LSEG I/B/E/S, https://lipperalpha.refinitiv.com/wp-content/uploads/2024/07/TRPR_82221_755.pdf [6] FactSet Research, Inc., https://advantage.factset.com/hubfs/Website/Resources%20Section/Research%20Desk/Earnings%20Insight/EarningsInsight_032824.pdf [7] FactSet Research, Inc. https://advantage.factset.com/hubfs/Website/Resources%20Section/Research%20Desk/Earnings%20Insight/EarningsInsight_062124.pdf [8] CME Group, https://www.cmegroup.com/markets/interest-rates/cme-fedwatch-tool.html [9] CNBC, https://www.cnbc.com/2024/06/28/may-pce-inflation-report.html [10] KPS Research, TradingView, July 2, 2024 [11] JP Morgan Asset Management, https://am.jpmorgan.com/content/dam/jpm-am-aem/global/en/insights/market-insights/guide-to-the-markets/mi-guide-to-the-markets-us.pdf[12] Blackrock, https://www.blackrock.com/us/financial-professionals/literature/presentation/uswa-market-portfolio-insights-deck.pdf?signInAppWithOkta=true
Important Disclosures
Investment Advisory Services offered through Krilogy®, an SEC Registered Investment Advisor. Please review all prospectuses and Krilogy’s Form ADV 2A carefully prior to investing. This is neither an offer to sell nor a solicitation of an offer to buy the securities described herein. An offering is made only by a prospectus to individuals who meet minimum suitability requirements.
All expressions of opinion are subject to change. This information is distributed for educational purposes only, and it is not to be construed as an offer, solicitation, recommendation, or endorsement of any particular security, products, or services.
Diversification does not eliminate the risk of market loss. Investments involve risk and unless otherwise stated, are not guaranteed. Investors should understand the risks involved of owning investments, including interest rate risk, credit risk and market risk. Investment risks include loss of principal and fluctuating value. There is no guarantee an investing strategy will be successful. Past performance is not a guarantee of future results. Indices are not available for direct investment; therefore, their performance does not reflect the expenses associated with the management of an actual portfolio. The S&P data is provided by Standard & Poor’s Index Services Group.
Services and products offered through Krilogy® are not insured and may lose value. Be sure to first consult with a qualified financial advisor and/or tax professional before implementing any strategy discussed herein.