Click to View PDF
Q3 2024 Review
Equity Market
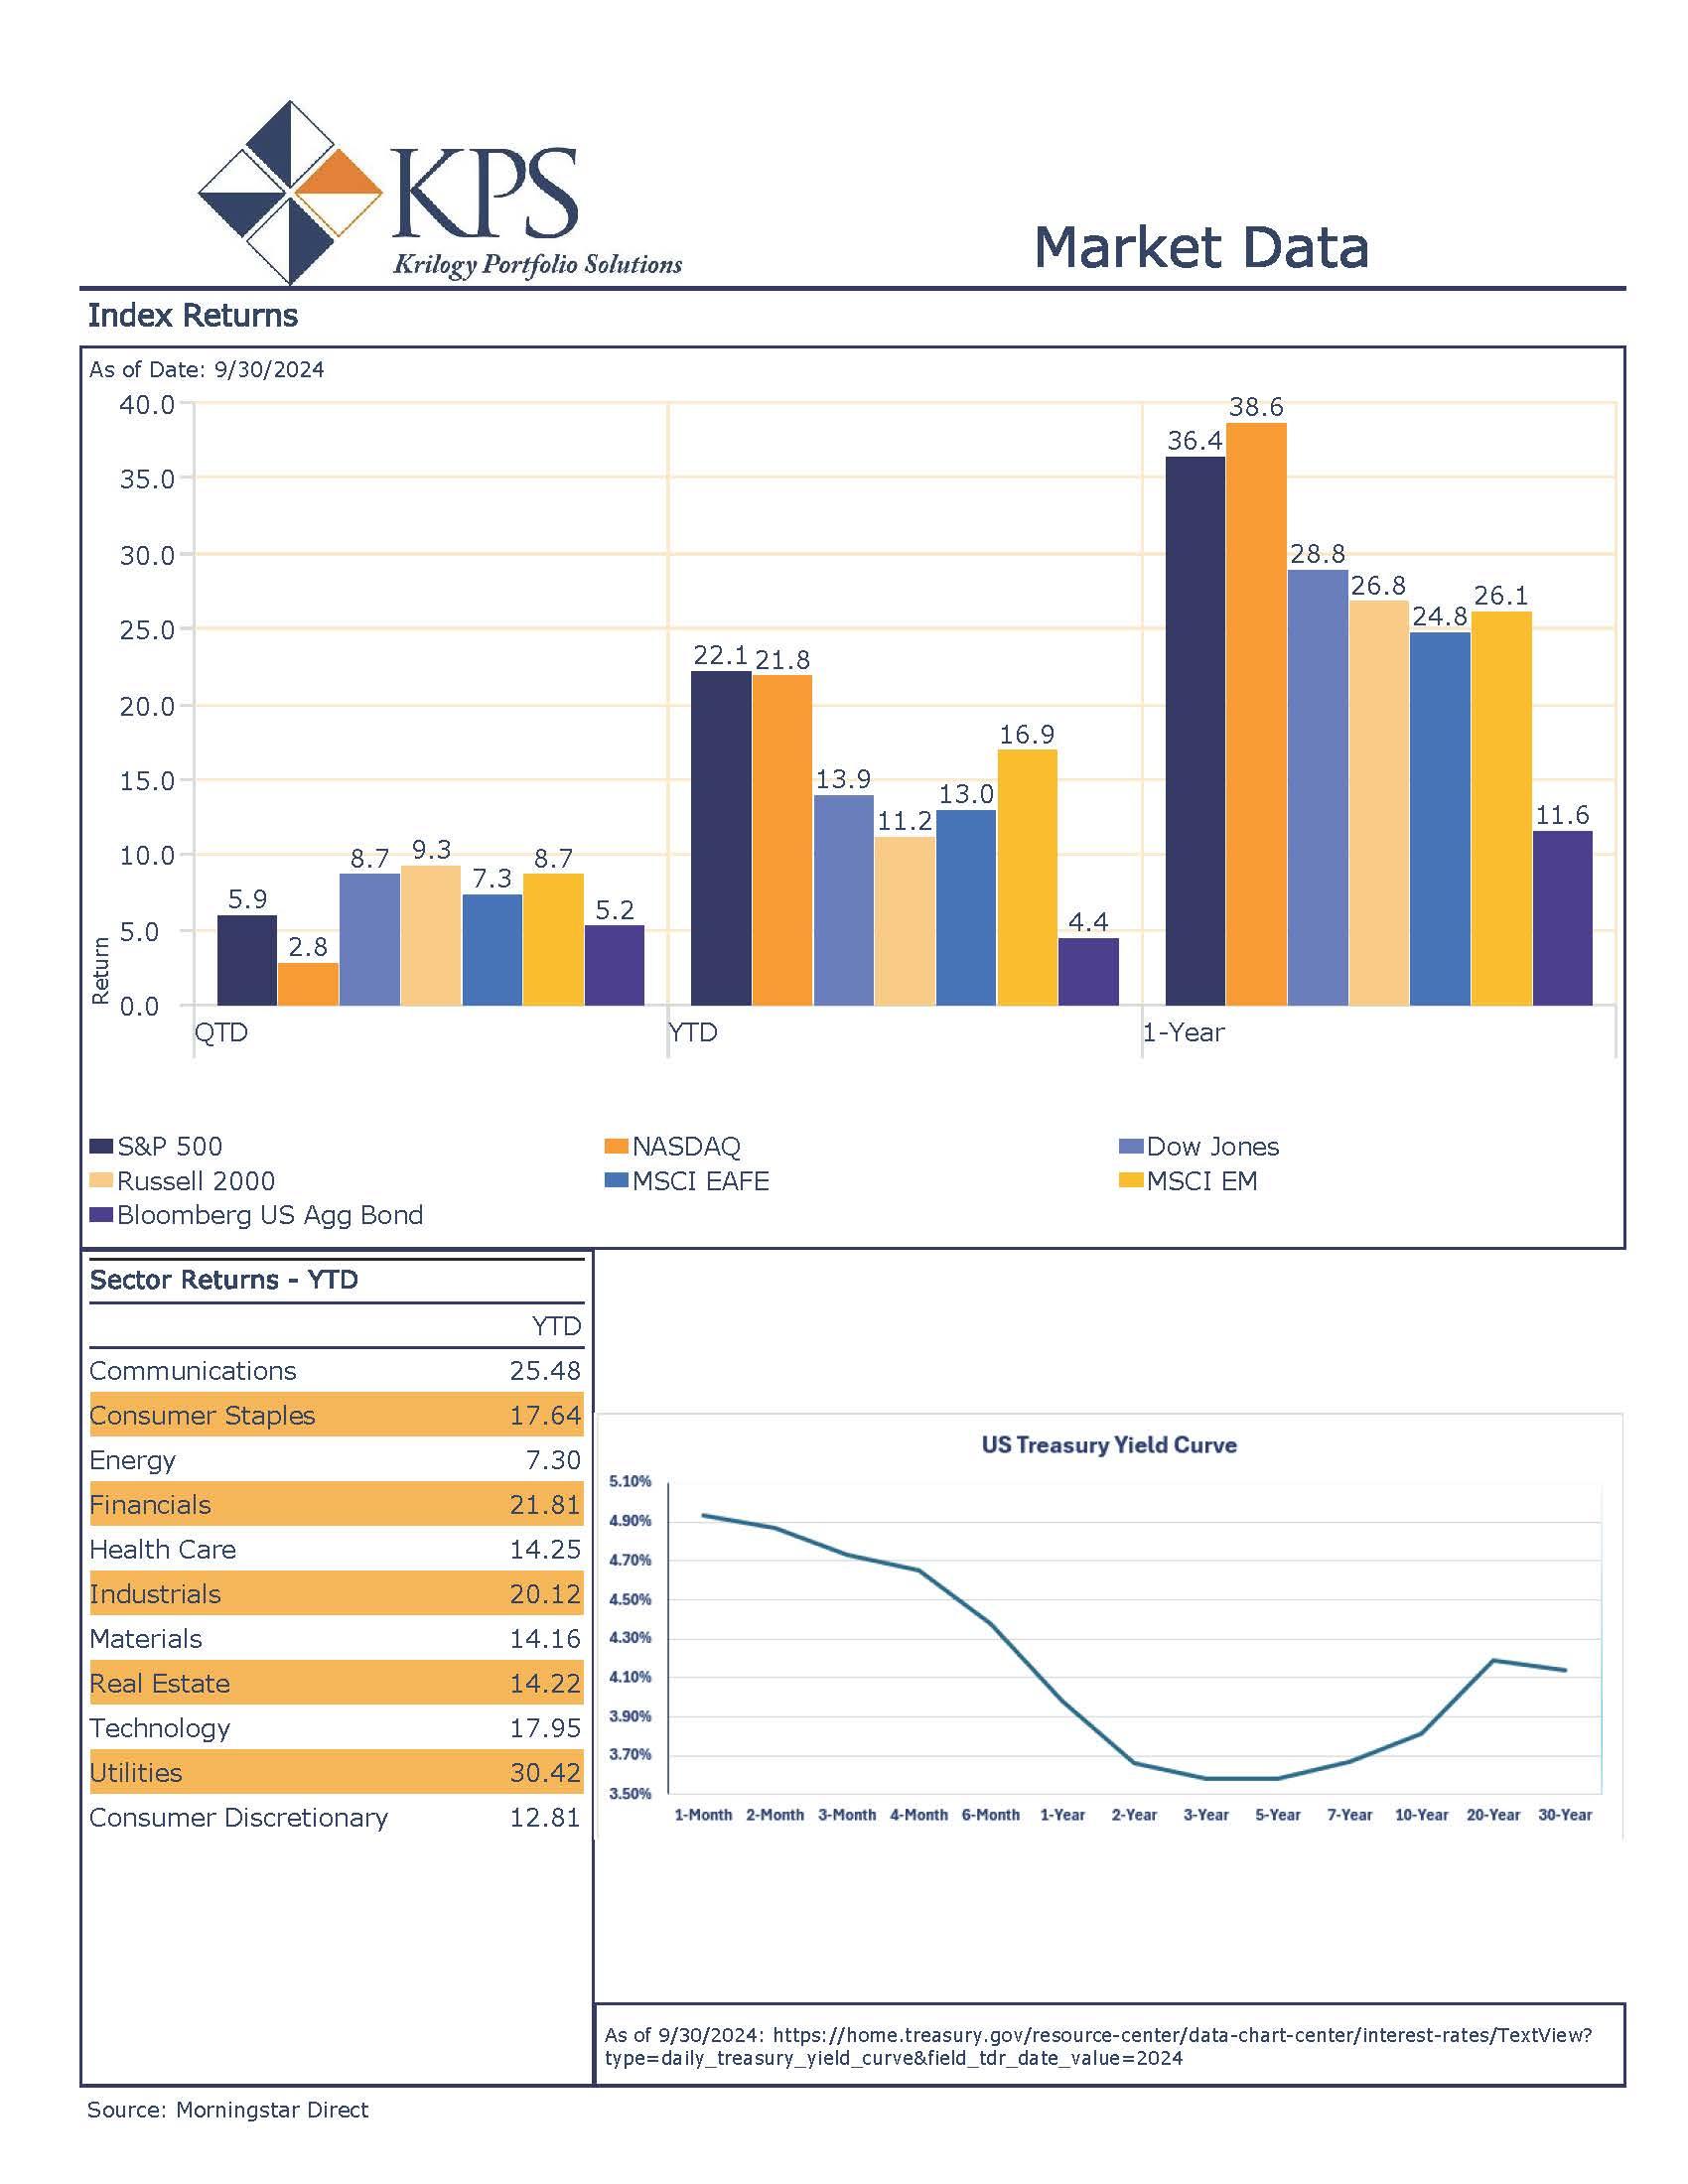
The market had a rough patch at the beginning of the quarter which saw the S&P 500 fall nearly 10% but rallied to end the quarter positive. The S&P 500 ended the quarter up 5.9%. Market breadth improved and investors saw greater participation outside of mega-cap Tech. The NASDAQ finished the quarter up only 2.8% as investors rotated out of growth names in favor of more value sectors. Utilities were the top-performing sector during the quarter, finishing up 19.37%[1]. The similar theme of AI helped fuel the rally in utilities as market participants realized the energy demand that AI will have on our infrastructure. Close behind utilities, was real estate ending the quarter in the green by 17.17%.
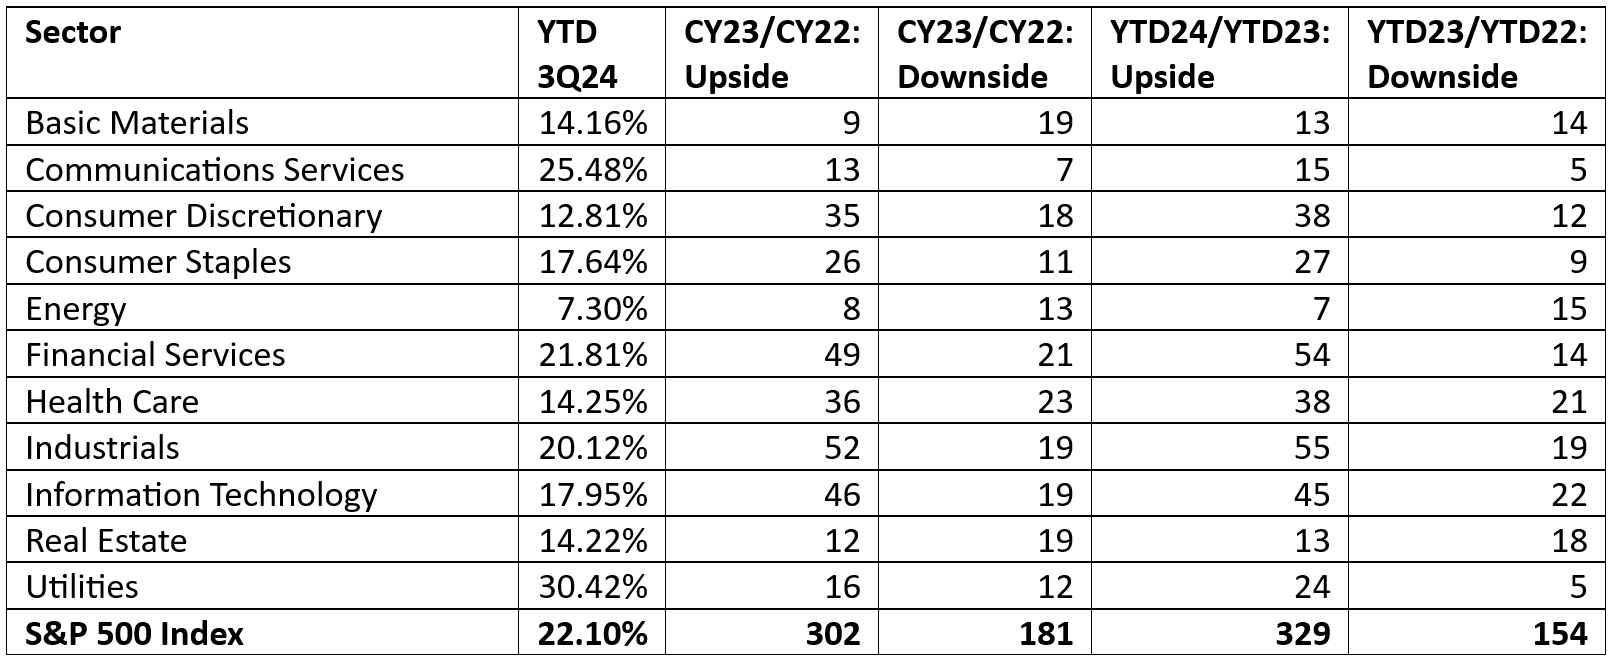
Earnings came in strong and surprised to the upside with the S&P 500 delivering year-over-year earnings growth of 11.3%, well above the 8.9% analysts were expecting on June 30[2]. Prior to last quarter, technology had driven earnings growth at the index level since Q3 23[3]. Technology once again had strong earnings results with 20% year-over-year growth, but the S&P 500 Index ex-Technology posted earnings growth of 8.5%3. Last quarter was a great example of why investors should maintain a diversified strategic allocation. The market shifted and recent out of favor sectors became the market leaders. It’s important to look at earnings from a relative perspective, not only on absolute growth. Below is a table that shows sector earnings growth relative to previous quarters[4]. To note, the utilities sector has the greatest earnings momentum and also is the top-performing sector year-to-date.
Fixed Income Market
The highlight for the quarter in the fixed-income market was the rate cut on September 18th. Policymakers cut the Fed Fund’s rate by 50 basis points, marking the end of the tightening cycle that began in March 2022. The long end of the yield curve remained relatively flat following the cut, but, the yield on the 10-year Treasury fell 0.60 during the quarter and ended at 3.74%. Another important development was the un-inversion of the yield curve. Since July 2022, the 2-year Treasury yield has been higher than the 10-year Treasury yield, which lasted for 783 days marking the longest 2’s/10’s inversion in history[5]. Following the rate cut, policymakers indicated they were likely to cut rates two more times through the end of the year, but only at a pace of 0.25%. Their data-dependent stance remains, as they move into their easing cycle.
As rates declined last quarter, fixed-income investors were rewarded with positive bond returns. The Bloomberg US Aggregate Bond Index finished the quarter up 5.2%. Credit spreads also remain tight and closed the quarter at 3.03% after a brief spike in early August to 3.93%. The high yield spread measures the yield between riskier “junk” bonds and the maturity equivalent US Treasury securities. This spread is a common measurement of investors’ risk-taking appetite. When fear overtakes the market, this spread has historically widened as riskier bonds are sold to purchase the relative security of Treasury Bonds.
Economic
The most notable economic development from the quarter was the continued slowing of inflation, which led the interest rate cut in September. In August, the Fed’s preferred inflation gauge, the Personal Consumption Expenditures Price Index (PCE), hit its lowest level since February 2021. The headline reading showed price increases of 2.2% year-over-year and the core reading, which excludes food and energy, rose 2.7% year-over-year. While still not at the 2% target, inflation has significantly improved since the peak in June 2022 of 7.1%.
Economic data continues to come in mixed, however. The labor market has continued to cool with the unemployment rate reaching 4.3% in July, but ticked down to 4.2% in August. While these are not concerning numbers by themselves, it may indicate a trend development featuring continued weakening in the labor market. The reading in July triggered the recently popular Sahm Rule. This indicator aims to be a more timely indicator of labor market weakness and ultimately economic slowdowns. When the three-month average of unemployment increases by 0.5% or more from its 12-month low, the likelihood of a recession in the near-term increases, from a historical perspective. The chart below shows the Sahm Rule trigger points going back 50+ years and S&P 500 price chart[6]
S&P 500 Index (black) and Sahm Rule Indicator (red)
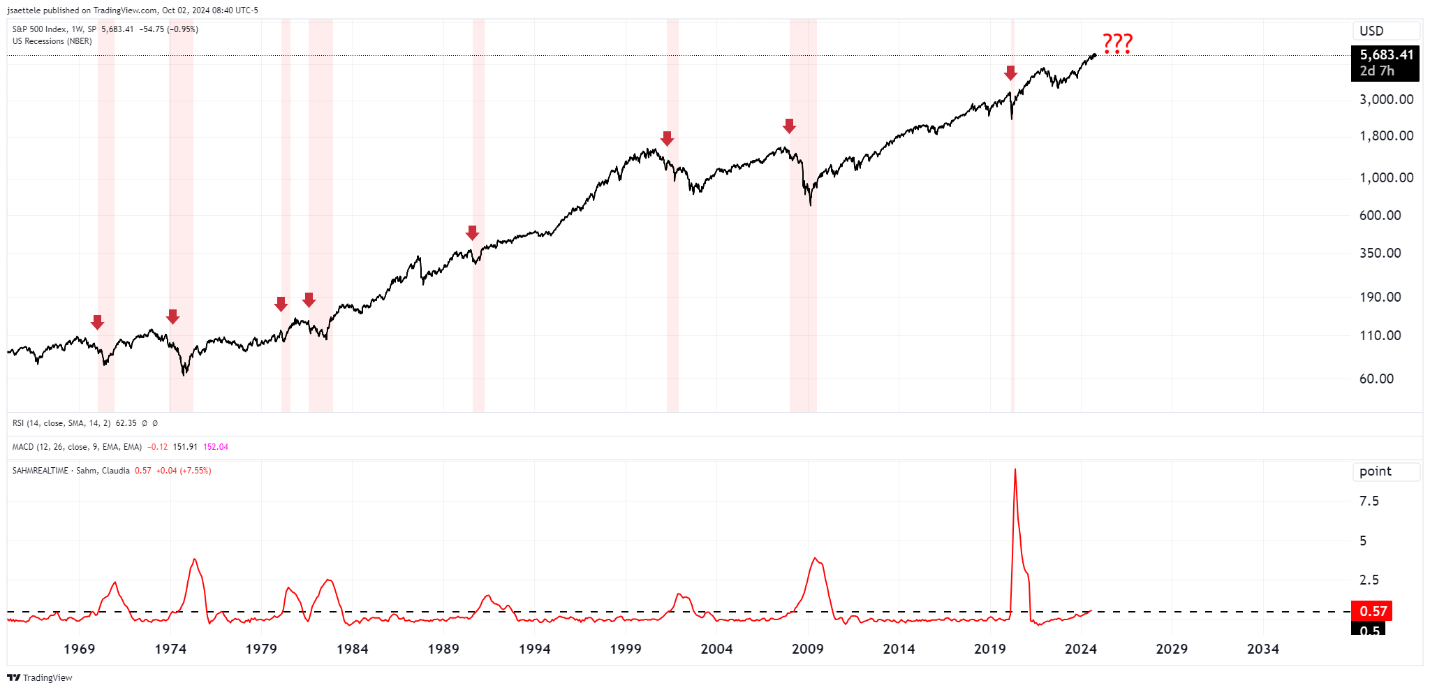
The Federal Reserve has a dual mandate, price stability, and a strong labor market. They have made significant progress on price stability but as we see weakness forming in the labor market, we believe the latter mandate will begin to take the spotlight.
Q4 2024 Outlook
Equity Market
The market is ripe for elevated volatility. The election will be here in a matter of weeks and we continue to get signals for a weaker economic road ahead. Economic weakening, slowing earnings, or even a recession, do not point to an automatic market meltdown. Historically, the S&P 500 intra-year drawdown is roughly 14%, the chart below from JP Morgan shows the max drawdown for a given year and its respective annual return going back to 1980[7].
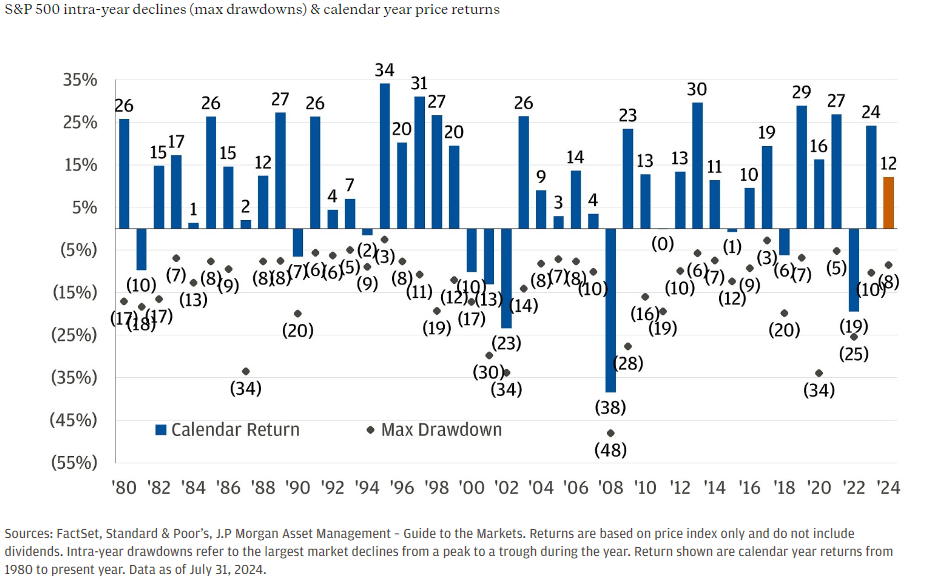
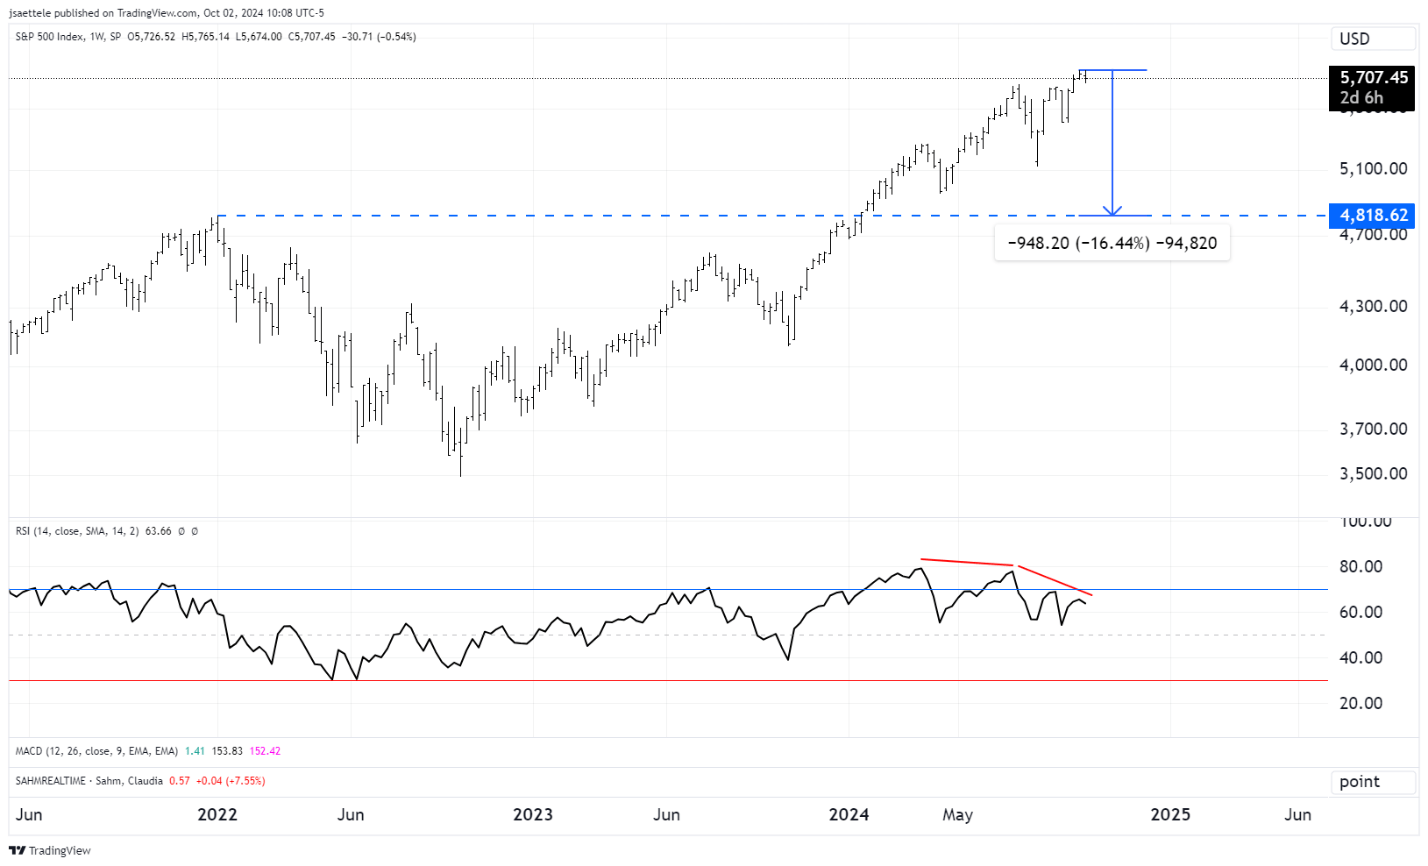
A pullback that would be average according to historical standards would put the S&P 500 near 4,819 which is the January 2022 high. The level can be seen below[8]:
We believe indicators have a reason for existence. They are not 100% right, but they can be a guide to understanding risk-taking environments and times to be slightly more guarded. While we do not see a material breakdown in the markets as a high probability, we see pockets of weakness in economic data, labor market cracks, valuations, and downward earnings revisions all increasing the probability of a market pullback.
Fixed Income Market
Now that the Fed has started their easing cycle, we encourage investors to review their cash holdings and differentiate between the portions for near-term liquidity needs and what can take risks in the bond market. Historically, cash has been inferior to bonds through rate-cutting cycles. The bond market has doubled the performance of cash during a rate-cutting cycle going back to 1970[9]. As the Fed continues to lower rates on the short end investors should anticipate a precipitous drop in cash yields. Policymakers have a much greater influence on the short end of the curve while market dynamics, with monetary policy, influence mid and long-term yields. We believe that after identifying what percentage of your allocation currently in cash/cash alternatives can take on slightly more risk, investors should look to extend out in maturity to lock in, what we consider, attractive yields. The chart below from Blackrock shows various asset class returns during a cutting cycle[10].

In prior market updates, we have noted that the un-inversion of the yield curve has historically been a better indicator of a nearing recession. While recessions have historically begun following the un-inversion, the yield curve un-inverting does not mean there will be a recession. Policymakers are still on pace to achieve the ever-elusive “soft-landing” but risks of a slowing economy remain. Quality fixed income has historically been a portfolio stabilizer during times of equity market weakness. Through the end of the year, we expect the 10-year Treasury yield to stay rangebound in the 4.5-5% range. The Fed is expected to cut rates two more times this year. The pace of these cuts is still up for debate. We believe that a cadence of 25 basis points will be a sufficient path to the ultimate neutral rate and if we were to see larger cuts this year, it would likely accompany a material deterioration in the economic environment.
Conclusion
As long-term investors, we believe reviewing your strategic allocations close to market highs is more prudent than during a fear-driven market panic. This allows you to identify potential concentrations in risk that could lead to emotional decision-making during times of volatility. Ensuring your allocations and risk exposures align increases the probability of meeting your long-term financial goals.
At Krilogy®, we are committed to helping you effectively navigate the ever-changing market environment. As long-term investors, we believe it is critical to remain patient and stick to the plan that was developed for your unique situation to arrive at a personal allocation target. Our entire team remains dedicated to helping you achieve your financial goals.
Sources:
[1] S&P Dow Jones Indices; https://www.spglobal.com/spdji/en/documents/performance-reports/dashboard-us-sector.pdf
[2] FactSet Research Inc; https://insight.factset.com/sp-500-earnings-season-update-august-9-2024
[3] Blackrock; https://www.blackrock.com/us/financial-professionals/literature/presentation/uswa-market-portfolio-insights-deck.pdf
[4] KPS Research, Morningstar Direct
[5] U.S. Global Investors, https://www.usfunds.com/resource/the-yield-curve-inversion-just-ended-but-economic-risks-remain/#:~:text=Typically%2C%20the%20spread%20between%20the,such%20period%20in%20U.S.%20history
[6] KPS Research, Trading View
[7] JP Morgan Private Bank, https://privatebank.jpmorgan.com/apac/en/insights/markets-and-investing/tmt/7-considerations-to-make-the-most-of-market-volatility
[8] KPS Research, Trading View
[9] Blackrock; https://www.blackrock.com/us/financial-professionals/insights/investment-directions-fall-2024
[10]Blackrock; https://www.blackrock.com/us/financial-professionals/literature/presentation/uswa-market-portfolio-insights-deck.pdf
Important Disclosures
Investment Advisory Services offered through Krilogy®, an SEC Registered Investment Advisor. SEC Registration should not imply SEC approval or expertise. Please review all prospectuses and Krilogy’s Form ADV 2A carefully prior to investing. This is neither an offer to sell nor a solicitation of an offer to buy the securities described herein. An offering is made only by a prospectus to individuals who meet minimum suitability requirements.
All expressions of opinion are subject to change. This information is distributed for educational purposes only, and it is not to be
construed as an offer, solicitation, recommendation, or endorsement of any particular security, products, or services. Diversification does not eliminate the risk of market loss. Investments involve risk and unless otherwise stated, are not
guaranteed. Investors should understand the risks involved of owning investments, including interest rate risk, credit risk and
market risk, among others. Investment risks include loss of principal and fluctuating value. There is no guarantee an investing strategy will be successful. Past performance is not a guarantee of future results. Indices are not available for direct investment; therefore, their performance does not reflect the expenses associated with the management of an actual portfolio. The S&P data is provided by Standard & Poor’s Index Services Group.
Services and products offered through Krilogy® are not insured and may lose value. Be sure to first consult with a qualified
financial advisor and/or tax professional before implementing any strategy discussed herein.