Stocks consolidated, mostly beneath the surface of the index. The S&P 500 returned 2.3% after a 15.2% second quarter, as the AI trade cooled and leadership rotated toward energy, health care, and software.
Interest rates surged higher. The 10-year Treasury yield broke through 5% and ended the quarter at 5.29%, and the Fed delivered its first rate hike in three years.
With concentration and investor positioning at historic extremes and breadth weakening beneath the index level, we favor discipline, rebalancing, and diversification in equities, while bonds now offer their most compelling income in years.
Last quarter we wrote that the seasonal roadmap pointed toward choppier trade into early October and that we would not be surprised to see the market consolidate its gains. That is largely what the third quarter delivered. After a 15.2% gain in the second quarter, the S&P 500 returned 2.3%2 and the broader Morningstar US Market Index gained just 1.36%3. The calm headline numbers hide a busy quarter, though. Stocks bounced in mid-August, drifted sideways through much of September, and leadership rotated sharply underneath the surface.
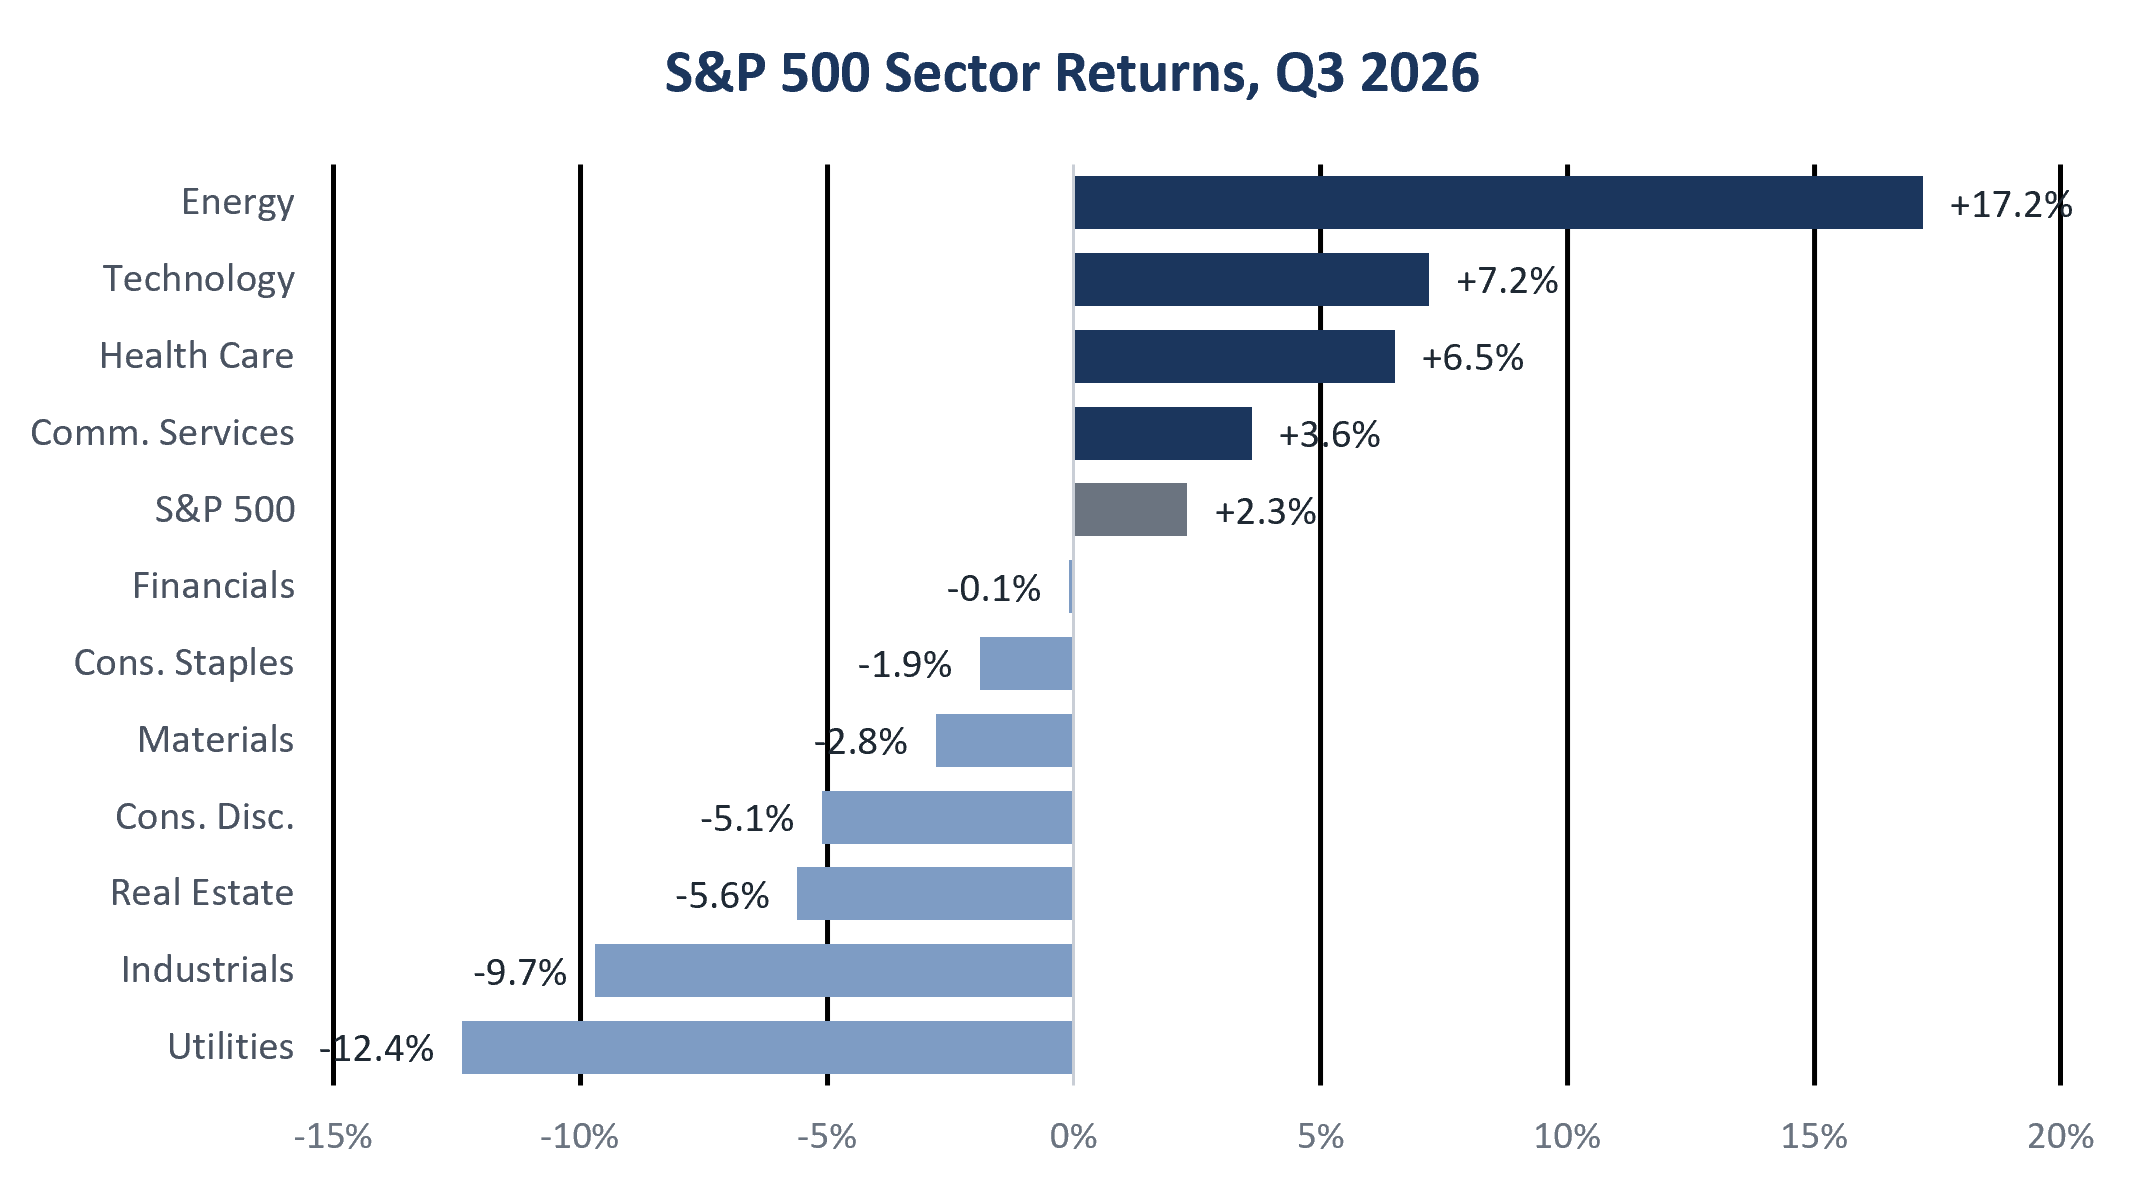
Total return, quarter ended 9/30/2026. Source: J.P. Morgan Asset Management, Guide to the Markets U.S. 4Q 2026; FactSet, Standard & Poor’s. Past performance is no guarantee of future results.
The AI trade, which has carried the market for more than three years, lost momentum. A growing chorus of executives and industry experts raised concerns about AI safety, and in conjunction the semiconductor and chip equipment names that led the first half were among the biggest drags on the market. Software was the notable exception. After spending most of the year as the poster child for AI disruption, software stocks rallied in August on solid earnings and the realization that the feared collapse in demand has not shown up. Microsoft alone gained more than 33% for the quarter, and a late-September rally in AI names helped the broader group recover some ground into quarter-end.
The sector scorecard tells the rest of the story. Energy led with a 17.2% gain as oil prices climbed alongside renewed conflict with Iran, with technology (+7.2%) and health care (+6.5%) also contributing. Utilities (-12.4%) and real estate (-5.6%), two sectors that have historically moved inversely with Treasury yields, struggled as rates climbed, and industrials (-9.7%) also lagged. Leadership has broadened meaningfully this year: the Magnificent 7 and the remaining 493 companies in the S&P 500 have each returned about 12% year to date, and the Magnificent 7 have accounted for about a third of the index’s gain, down from more than half in 2023 and 2024.2 Small caps gave back part of their first-half advance, with the Russell 2000 falling roughly 7% in the quarter. Overseas, developed markets gained 0.8% and emerging markets slipped 0.4% in the quarter1, though emerging markets remain up more than 23% for the year, powered by extraordinary gains in Korea (+98%) and Taiwan (+71%).2
Fundamentals remain the bright spot. Consensus estimates call for S&P 500 earnings growth of nearly 32% in 2026, compared with an average of under 8% from 2001 to 2025, and the bulk of that growth is coming from expanding profit margins. Earnings, not multiple expansion, have done the heavy lifting this year, which is a healthier foundation for a bull market.
Fixed Income Market
Bond Sector
Yield 9/30/26
Yield 12/31/25
2026 YTD Return
2-Year Treasury
4.88%
3.47%
+0.3%
10-Year Treasury
5.29%
4.18%
-5.3%
30-Year Treasury
5.64%
4.84%
-8.1%
Bloomberg US Aggregate
5.56%
4.32%
-2.9%
Investment Grade Corporates
6.04%
4.81%
-3.1%
Mortgage-Backed Securities
5.95%
4.63%
-3.3%
Municipals
4.78%
3.60%
-4.2%
U.S. High Yield
8.35%
6.53%
+0.1%
Leveraged Loans
8.95%
8.10%
+3.5%
Source: J.P. Morgan Asset Management, Bloomberg, as of 9/30/2026. Yields reflect yield to worst.2
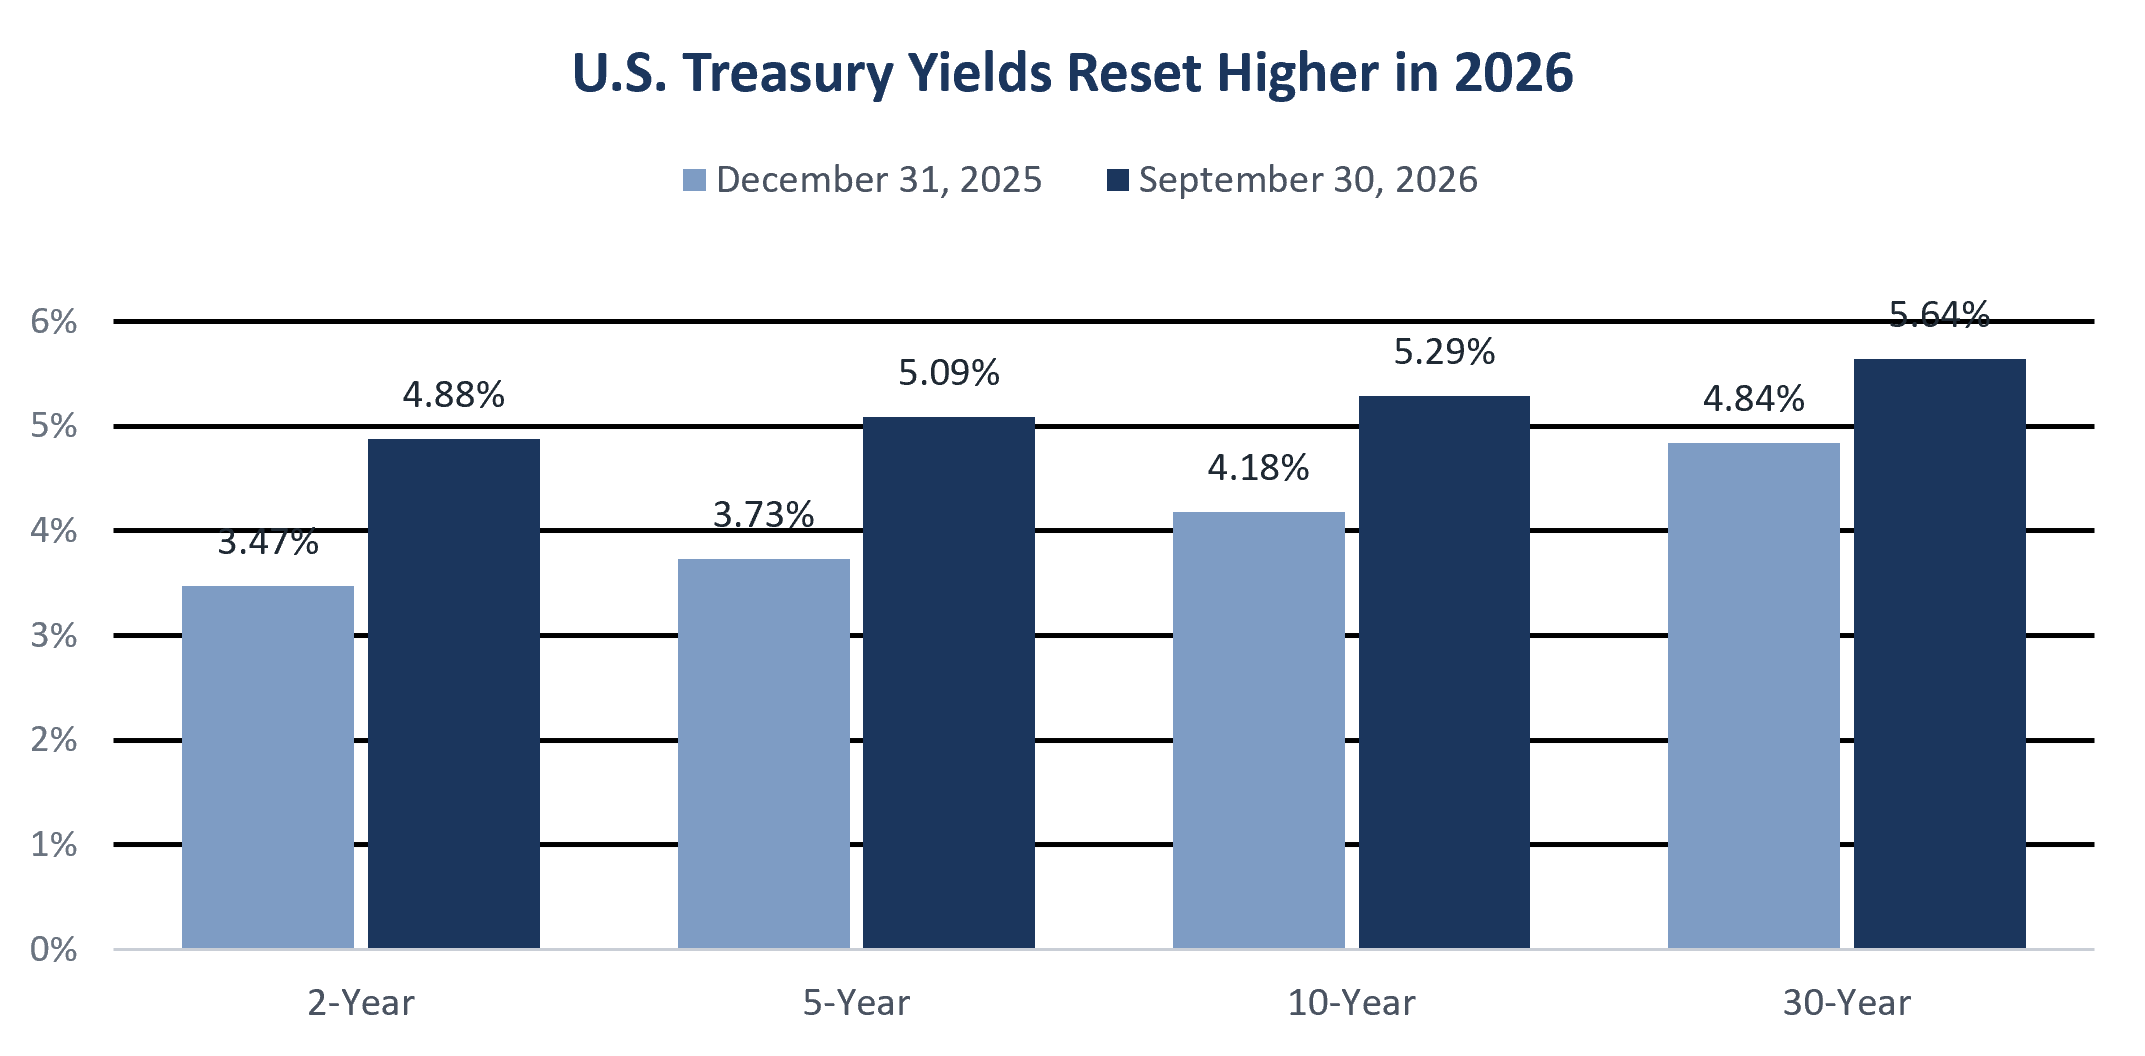
The bond market was the story of the quarter, and not a pleasant one. Worries over stubborn inflation, a resurgent oil price, heavy government borrowing, and the wave of corporate debt issued to fund the AI buildout pushed Treasury yields to multi-decade highs.3 The 10-year Treasury crossed the closely watched 5% threshold in mid-September and finished the quarter at 5.29%, up 82 basis points from the end of June, while the 30-year closed at 5.64%.2 Unlike the second quarter, the long end led the move. The 2-year rose roughly 70 basis points to 4.88%, and the spread between the 2-year and 10-year widened to 41 basis points from 29 at the end of June.
Yield by maturity. Change from year-end 2025: 2-year +141 bps, 5-year +136 bps, 10-year +111 bps, 30-year +80 bps. Source: J.P. Morgan Asset Management, Guide to the Markets U.S. 4Q 2026; FactSet, Federal Reserve, U.S. Treasury. Data as of 9/30/2026.
For bond investors, the result was a tough quarter. The Bloomberg US Aggregate is now down 2.9% for the year, with the 10-year Treasury down 5.3% and the 30-year down 8.1%. Shorter maturities and floating-rate sectors held up best, as the 2-year Treasury is modestly positive and leveraged loans have gained 3.5% year to date.
In September, the Federal Reserve raised its policy rate by a quarter point to a range of 3.75% to 4.00%, its first hike in three years. It was the first real test for Chair Kevin Warsh, whose sparse guidance over the summer had kept markets guessing. This time he was clear that inflation has run too high for too long and that the committee intends to restore price stability on a faster timeline. Futures markets currently assign roughly 30% odds to two more hikes before year-end.3 The committee’s updated projections call for headline PCE inflation of 3.7% and core PCE of 3.4% by the end of 2026, easing to 2.3% and 2.5%, respectively, in 2027.2
Economic
The economy continues to hold up better than the headlines suggest. Real GDP grew at a 2.2% annualized pace in the second quarter, with consumer spending and business investment doing the heavy lifting. Job growth has slowed, with payrolls averaging about 71,000 per month over the three months through August, but the unemployment rate improved to 4.1% from 4.3% earlier in the year.2
Inflation is telling a split story. Headline CPI eased to 3.4% in August from a May peak of 4.2%, and core CPI, which strips out food and energy, is running at just 2.4%. Core PCE, the Fed’s preferred gauge, has cooled to 3.0% from 3.4% in May. In other words, today’s inflation problem is primarily an energy problem. Oil climbed above $107 per barrel in mid-September as the conflict with Iran flared again3 before settling near $90 at quarter-end.2 The Fed’s willingness to hike while core inflation is moderating tells us how seriously it takes the risk of another energy shock becoming embedded in inflation expectations.
Q4 2026 Outlook
Equity Market
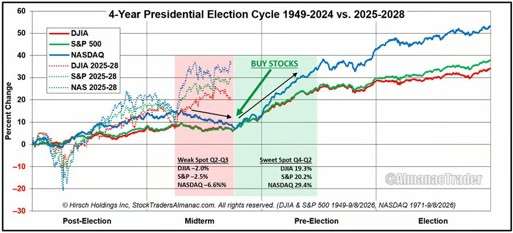
Last quarter we noted that early October has historically marked the low point of the four-year presidential cycle. The third quarter of a midterm year has typically been the weakest stretch of the cycle for U.S. equities, and that weakness has often set up what the Stock Trader’s Almanac calls the cycle’s sweet spot, running from the fourth quarter of the midterm year through the second quarter of the pre-election year, which in this cycle is 2027. In the average cycle since 1949, the S&P 500 has gained roughly 20% over that stretch, compared with a decline of 2.5% during the preceding weak spot.4Source: Hirsch Holdings Inc., StockTradersAlmanac.com. All rights reserved. DJIA and S&P 500 1949-9/8/2026, NASDAQ 1971-9/8/2026. Past performance is no guarantee of future results.
We are now at that point on the calendar, with midterms just weeks away. The roadmap has been a useful guide this year, but as the second quarter reminded us, seasonality is a tendency, not a law. This time the calendar is up against two meaningful headwinds: higher interest rates and a technical backdrop that has deteriorated beneath the surface.
Higher rates are the most important change in the fundamental backdrop this quarter. The S&P 500 trades at 19.0 times forward earnings, above its 30-year average of 17.2 times but below the 22-23 times range we saw at points over the past few years. What has changed is the competition. With high-quality corporate bonds yielding more, the S&P 500’s forward earnings yield now sits 1.0 percentage point below the yield on Baa-rated corporate bonds, compared with a 30-year average spread of +0.7 percentage points.2 Put simply, investors are being paid less to own stocks relative to bonds than they have been, on average, over the past three decades. Concentration also remains high, with the 10 largest companies making up 40.6% of the index’s market value while generating 36.1% of its earnings.
The AI Buildout Moves Into the Bond Market
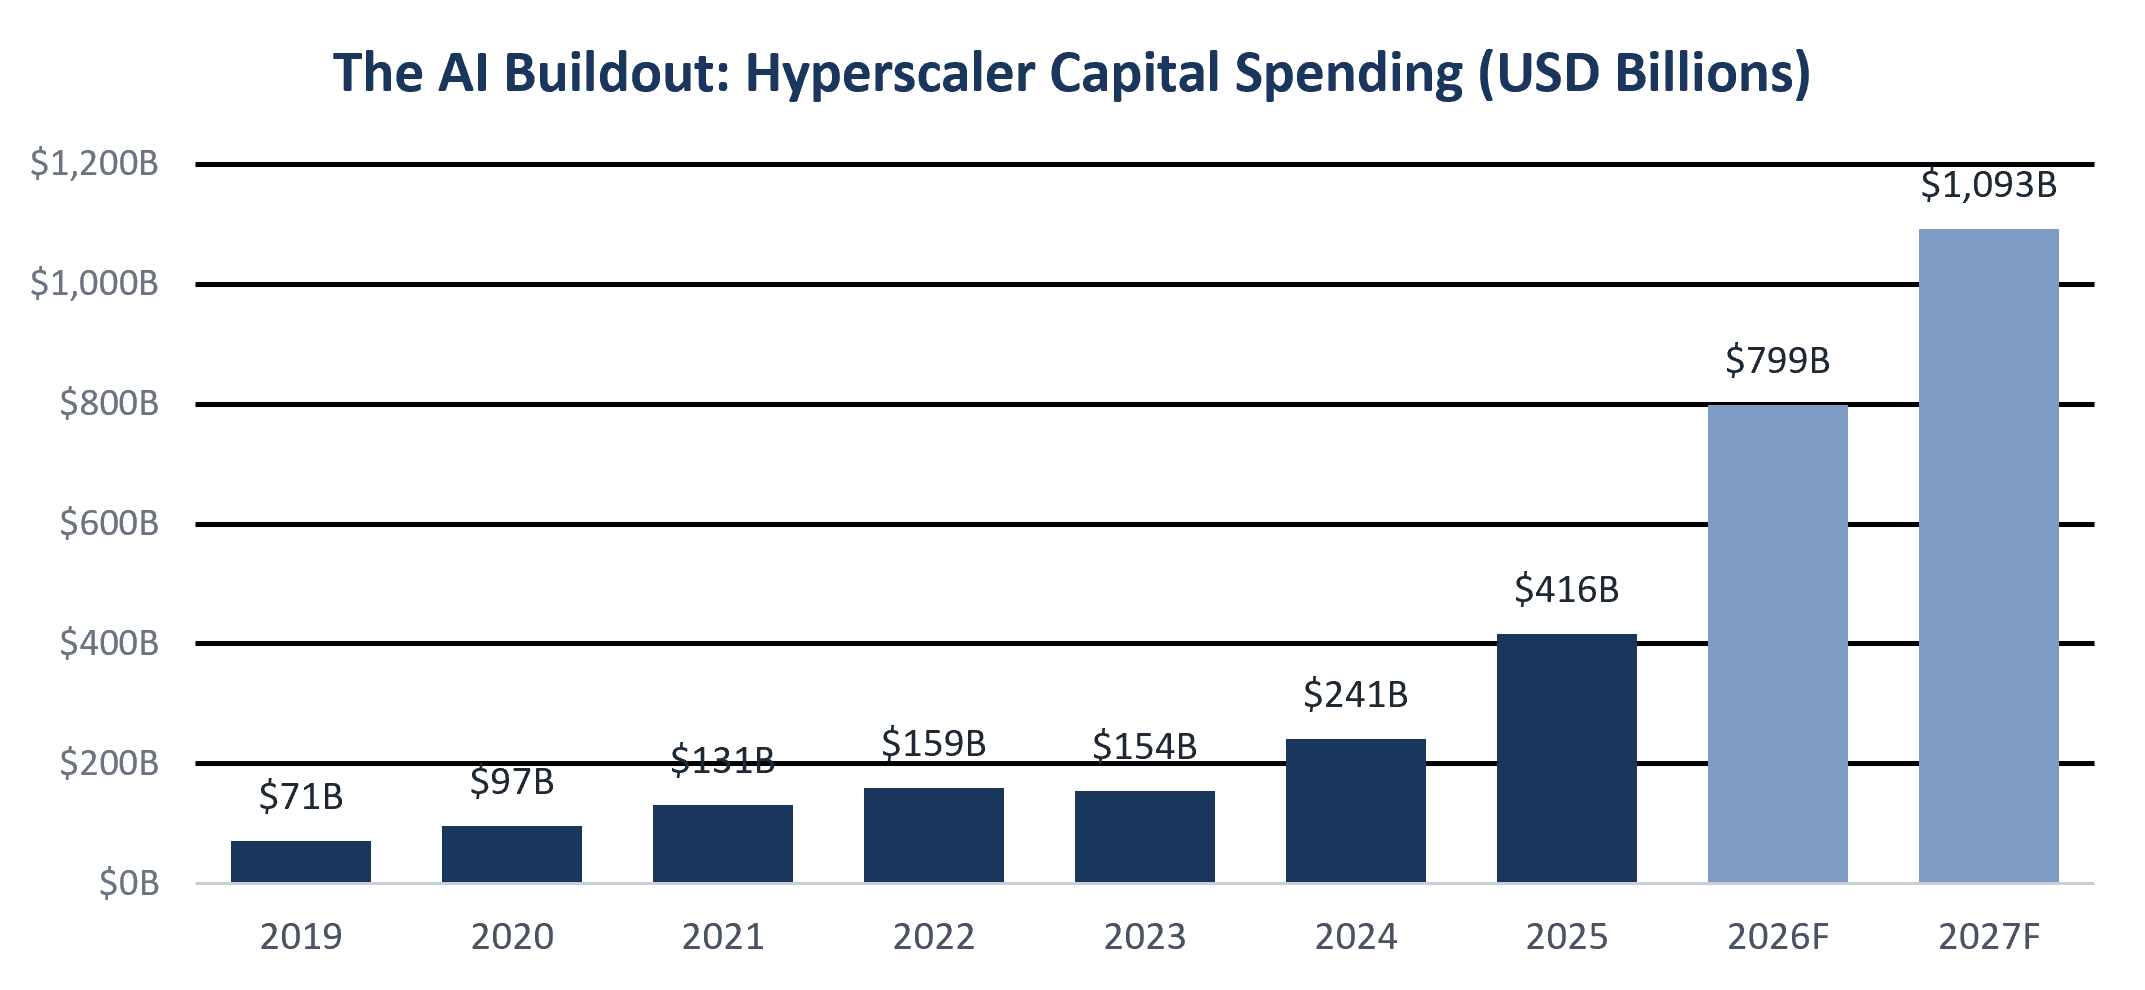
AI-related industries, including the hyperscalers, semiconductors, hardware, software, and power, now make up more than half of the S&P 500’s market capitalization.2 The spending behind that theme continues to accelerate, with the five largest hyperscalers expected to invest roughly $800 billion in 2026, nearly double last year, and consensus calling for more than $1 trillion in 2027.
Annual capital expenditures for Alphabet, Amazon, Meta, Microsoft and Oracle. 2026 and 2027 reflect consensus estimates, which are not guaranteed and may differ materially from actual results. Source: J.P. Morgan Asset Management, Guide to the Markets U.S. 4Q 2026; Bloomberg. Data as of 9/30/2026.
What has changed is how that spending is being financed. The largest hyperscalers have shifted from funding the buildout primarily through operating cash flow toward bond issuance and off-balance-sheet commitments.5 Balance sheets remain strong for now, with hyperscaler leverage, including lease commitments, at roughly 1.3 times EBITDA versus 2.7 times for the median investment grade issuer.2 Still, PIMCO makes an important point: AI investment does not have to contract to become less supportive of growth. It simply has to slow.5 With so much of the market and the economy tied to a single theme, that is a risk worth respecting, and a reason diversification matters more today, not less.
A Technical View
Source: BofA Global Investment Strategy, GFD Finaeon, Bloomberg. All U.S. sectors as % of U.S. market cap, except Japan (% of MSCI ACWI). AI Big 10 = Magnificent 7 + Broadcom, AMD and Micron.
Beneath the surface, the third quarter was far rougher than the index suggests. Most stocks did correct. According to our technical research, 86% of S&P 500 stocks declined at least 20% from their highs, yet the index itself ended September less than 2% below its all-time high.6 That gap is a product of extreme concentration. In a market-cap-weighted index like the S&P 500, results now hinge on a handful of the largest companies to a degree rarely seen in history.
Bank of America Global Research estimates that the AI Big 10, the Magnificent 7 plus Broadcom, AMD, and Micron, now represent 41% of U.S. market capitalization, matching the peak concentration of the 2000 technology bubble. Concentration can always climb further, but prior episodes, from the railroads of the 1800s to the Nifty Fifty and Japan in the late 1980s, have all eventually reversed.7 By some measures the picture is even more stretched. Charles Schwab notes that the five largest stocks made up 30.4% of the S&P 500 at quarter-end, compared with roughly 18% at the 2000 peak.8 Periods like this tend to be fueled by herding behavior, where enthusiasm outruns sober analysis, and history suggests they are short-lived.
Net debit balance in $bn divided by S&P 500 market capitalization. Source: FINRA, J.P. Morgan Flows & Liquidity. Last monthly observation August 2026.
Positioning tells a similar story. Institutional risk appetite, as measured by State Street Markets, sits near 25-year highs, with equity allocations of 57.4%, levels last seen in the run-up to the 2008 financial crisis.9 Households are just as committed. Ned Davis Research shows equities now account for a record 53% of total household financial assets, above the 45.2% reading at the 2000 market top and 38.3% before the financial crisis, and well over double the 22.3% reading after it.10
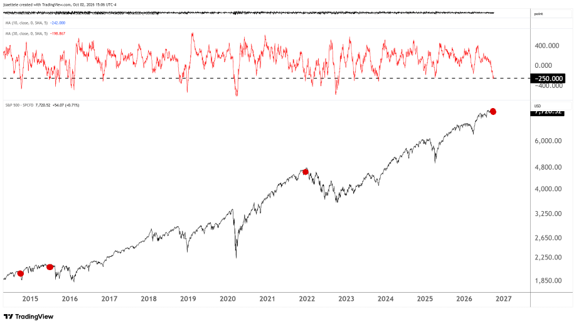
Leverage has followed suit. Net debit balances in margin accounts have surpassed their 2018 record and now sit at the highest level on record, which leaves the market more vulnerable to forced selling if prices turn lower.11 It is worth remembering that the fourth quarter of 2018, the midterm year of President Trump’s first term, brought a roughly 20% decline in the S&P 500 despite favorable seasonal tailwinds, before stocks recovered to new highs in 2019.6Red dots mark instances when the 30-day NYSE advance-decline line fell below -250 with the S&P 500 within 3% of its all-time high. Source: KPS Research, TradingView, as of 10/2/2026. Past performance is no guarantee of future results.
Breadth is the final piece. A popular gauge is the 30-day NYSE advance-decline line, which adds up net advancing issues over the prior 30 days. Deeply oversold readings have often produced timely buy signals for the S&P 500. Some view the recent washout as a sign the market has cleansed itself, but history warrants caution, because this time the S&P 500 did not decline along with breadth. There have been only three prior instances when this measure fell below -250 while the S&P 500 held within 3% of its all-time high: October 2014, July 2015, and December 2021. All three were followed by turbulence and market weakness of varying degrees.
In short, seasonal tendencies are favorable for the fourth quarter, but underlying breadth is cause for concern. From a bigger-picture standpoint, investors are all in and concentration sits at historic extremes, a combination that has historically been a headwind for forward returns.
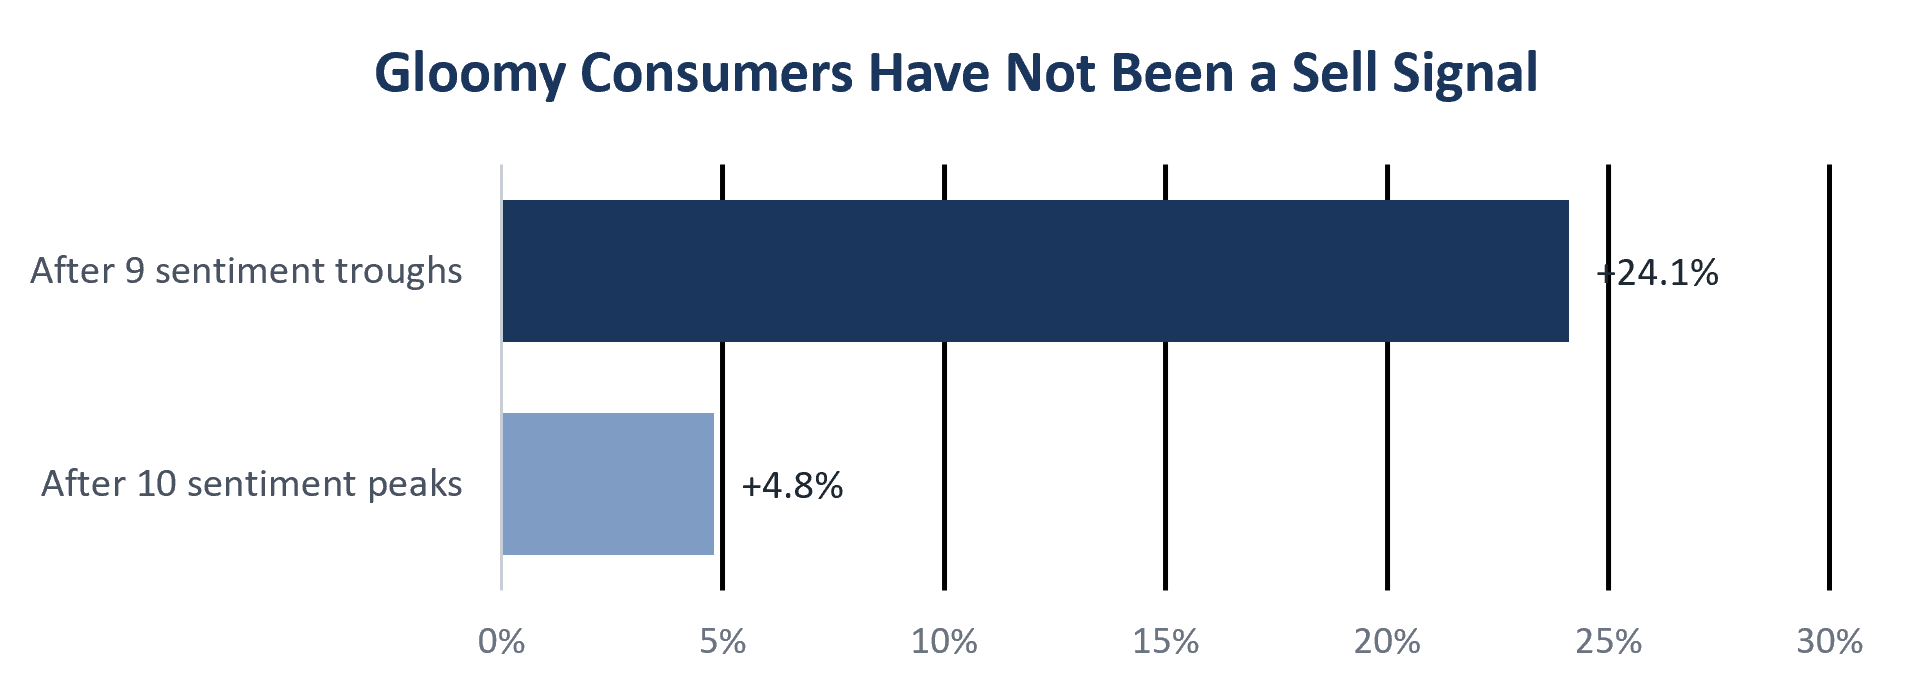
There is one counterweight worth noting. While investors are heavily positioned in equities, consumers tell a very different story. The University of Michigan’s sentiment index fell to 48.1 in September, far below its long-term average of 77.2, as higher gas prices and borrowing costs weigh on households. Historically, troughs in consumer sentiment have been followed by an average S&P 500 gain of 24.1% over the next twelve months, compared with 4.8% following sentiment peaks.2 We would not treat this as a timing signal, and there is no way to know whether September marks the bottom, but it is a useful reminder that gloomy headlines and poor equity returns do not always go hand in hand.
Average subsequent 12-month S&P 500 price return following University of Michigan consumer sentiment peaks and troughs since the early 1970s. September 2026 reading: 48.1 vs. long-term average of 77.2. Source: J.P. Morgan Asset Management, Guide to the Markets U.S. 4Q 2026; FactSet, Standard & Poor’s, University of Michigan. Past performance is no guarantee of future results.
Putting it all together, we remain cautiously optimistic, with an emphasis on caution. Earnings growth is strong and broadening, the economy is resilient, and the calendar is entering what has historically been the strongest stretch of the presidential cycle. On the other side of the ledger, valuations leave little room for disappointment, breadth has deteriorated beneath a near-record index, concentration and investor positioning sit at historic extremes, and a 5% Treasury yield raises the bar for stocks. We believe this is a market that rewards discipline over bold bets: stay invested, rebalance toward targets, and lean on diversification rather than concentration.
Fixed Income Market
We want to be direct about our call from last quarter. We wrote that we believed the 5% level on the 10-year Treasury likely marked the cycle high and that any retest would likely be short-lived. The 10-year moved through 5% in September and continued climbing into early October, so that view did not hold. It is worth understanding why. The rise has been driven mainly by higher real yields, while inflation expectations have remained largely unchanged despite the recent volatility in the oil markets. Estimates of the neutral interest rate, the rate that neither stimulates nor restrains the economy, have risen to roughly 1.5% from about 0.5% before the pandemic, reflecting stronger growth and productivity more than fiscal fears.5 In other words, the market is recalibrating to a world of structurally higher rates. That is consistent with our long-held view that rates will be higher for longer, even if the level surprised us.
Where does that leave bonds? In our view, in a stronger position than at any point in this cycle. The Bloomberg US Aggregate now yields 5.56%, and its real yield after inflation of 3.12% sits above its long-run average of 2.48%. Starting yields have historically explained roughly 89% of the variation in the Aggregate’s subsequent five-year returns.2 Income at these levels also provides a cushion against further price declines that simply did not exist in 2022. And bonds have historically done their most important job when it matters most: over the last century, bond returns were positive in 21 of the 25 years in which stocks declined.
Positioning-wise, we see value in high-quality, intermediate-maturity bonds, which capture much of the yield available further out the curve with less sensitivity to additional rate moves. Credit spreads remain near historical tights, with investment grade spreads in the 5th percentile and high yield in the 17th percentile of their ranges since 2001, so we continue to see little reward for reaching into lower-quality credit. We expect rate volatility to stay elevated while the Fed works through the energy shock, but at today’s yields, we believe income can do the heavy lifting.
Conclusion
If 2026 has a theme, it is that markets can reprice faster than anyone expects, in either direction. In the first half it was stocks swinging from a regional war to record highs. In the third quarter, it was the bond market resetting to multi-decade highs while stocks paused. Every market has its risks and tailwinds, but what is of utmost importance is ensuring that your allocations align with your desired level of risk. Having an appropriate strategic allocation that allows you to achieve your long-term financial goals at your desired risk level is the biggest help when navigating markets like these.
At Krilogy®, we are committed to helping you effectively navigate the ever-changing market environment. As long-term investors, we believe it is critical to remain patient and stick to the plan that was developed for your unique situation to arrive at a personal allocation target. Our entire team remains dedicated to helping you achieve your financial goals.
J.P. Morgan Asset Management, Guide to the Markets, U.S., 4Q 2026, data as of 9/30/2026
Morningstar, “7 Charts on Q3 Market Highlights: Stocks Tread Water While the Bond Market Shudders,” 10/1/2026
Hirsch Holdings Inc., Stock Trader’s Almanac, 4-Year Presidential Election Cycle, 1949-2024 vs. 2025-2028, data through 9/8/2026
PIMCO, Cyclical Outlook, “Growth Holds, Risks Widen,” October 2026
KPS Research, Technical Research, as of 10/2/2026
BofA Global Investment Strategy, GFD Finaeon, Bloomberg
Charles Schwab, as of 9/30/2026
State Street Markets, Risk Holdings Indicator
Ned Davis Research
FINRA, J.P. Morgan Flows & Liquidity, last monthly observation August 2026
Disclosures
Investment Advisory Services offered through Krilogy®, an SEC Registered Investment Advisor. Registration with the SEC should not be considered an express or implied approval of Krilogy by the SEC. Krilogy does not provide tax and legal advice. Please review all prospectuses and Krilogy’s Form ADV 2A carefully prior to investing. This is neither an offer to sell nor a solicitation of an offer to buy the securities described herein. An offering is made only by a prospectus to individuals who meet minimum suitability requirements.
All expressions of opinion are subject to change. This information is distributed for educational purposes only, and it is not to be construed as an offer, solicitation, recommendation, or endorsement of any particular security, products, or services.
Diversification does not eliminate the risk of market loss. Investments involve risk and unless otherwise stated, are not guaranteed. Investors should understand the risks involved of owning investments, including interest rate risk, credit risk and market risk. Investment risks include loss of principal and fluctuating value. There is no guarantee an investing strategy will be successful. Past performance is not a guarantee of future results. Indices are not available for direct investment; therefore, their performance does not reflect the expenses associated with the management of an actual portfolio. The S&P data is provided by Standard & Poor’s Index Services Group.
Services and products offered through Krilogy® are not insured and may lose value. Be sure to first consult with a qualified financial advisor and/or tax professional before implementing any strategy discussed herein.
For additional important disclosures, please visit https://www.krilogy.com/disclosures/important-disclosures/.
Cookies and privacy
We use cookies for site function, analytics, and advertising. You can accept all, reject optional cookies, or choose categories. Privacy policy
Your browser sent a Global Privacy Control signal, so advertising sharing stays off.
Cookie preferences
Necessary cookies keep the site working. Analytics helps us understand traffic. Advertising supports ads and conversion tracking.
Your browser sent a Global Privacy Control signal, so advertising sharing stays off.
You are now leaving the Krilogy Website and will be entering the Krilogy Client Portal website.
By clicking Continue, you will be taken to a third-party website that is not operated or maintained by Krilogy. We encourage you to review their privacy policy and security level, which may differ from our own. Please know that Krilogy does not monitor the content of third-party websites, nor do we guarantee their products or services. Any opinions expressed on third-party websites are not necessarily those of Krilogy.
Schwab is a registered broker-dealer, and is not affiliated with Krilogy Financial or any advisor(s) whose name(s) appear on this Website. Krilogy Financial is independently owned and operated. Schwab neither endorses nor recommends Krilogy Financial, unless you have been referred to us through the Schwab Advisor Network®. Regardless of any referral or recommendation, Schwab does not endorse or recommend the investment strategy of any advisor. Schwab has agreements with Krilogy Financial under which Schwab provides Krilogy Financial with services related to your account. Schwab does not review the Krilogy Financial Website, and makes no representation regarding the content of the Website. The information contained in the Krilogy Financial Website should not be considered to be either a recommendation by Schwab or a solicitation of any offer to purchase or sell any securities.
By clicking Continue, you will be taken to a third-party website that is not operated or maintained by Krilogy. We encourage you to review their privacy policy and security level, which may differ from our own. Please know that Krilogy does not monitor the content of third-party websites, nor do we guarantee their products or services. Any opinions expressed on third-party websites are not necessarily those of Krilogy.
You are now leaving the Krilogy Website and will be entering the Krilogy Tax Portal website.
By clicking Continue, you will be taken to a third-party website that is not operated or maintained by Krilogy. We encourage you to review their privacy policy and security level, which may differ from our own. Please know that Krilogy does not monitor the content of third-party websites, nor do we guarantee their products or services. Any opinions expressed on third-party websites are not necessarily those of Krilogy.
Krilogy Tax Services is a wholly owned subsidiary of Krilogy, LLC, Krilogy’s parent company. Krilogy Tax Services provides tax planning and tax return preparation services to Krilogy clients. Krilogy does not provide tax advice. All fees incurred for Krilogy Tax Services are separate and apart from any fees charged by Krilogy.
By clicking Continue, you will be taken to a third-party website that is not operated or maintained by Krilogy. We encourage you to review their privacy policy and security level, which may differ from our own. Please know that Krilogy does not monitor the content of third-party websites, nor do we guarantee their products or services. Any opinions expressed on third-party websites are not necessarily those of Krilogy.



 18 MIN READ